Covered Call Calculator: How to Grade Your Setup Before You Trade
You found a stock you like. You own 100 shares. You want to sell a covered call and collect some premium. So you open your broker, stare at the options chain, and ask yourself: is this a good setup?
Most covered call calculators will tell you the max profit, breakeven, and return if assigned. That's table stakes. It doesn't tell you whether you should take the trade.
A strike that looks great on paper — solid premium, nice yield — might have a spread so wide you'll give back half the premium on the fill. Or the delta might be too high for your risk tolerance. Or earnings are three days before expiration and you're about to get steamrolled by IV crush.
This guide walks through how to evaluate a covered call setup properly, not just the P&L math.
What a Basic Covered Call Calculator Tells You
Every options calculator out there gives you some version of the same three numbers:
Max profit — the premium collected plus any upside to the strike if you're selling out of the money. If you own shares at $50, sell the $55 call for $1.20, your max profit is $6.20 per share ($1.20 premium + $5.00 upside to strike).
Breakeven — your cost basis minus the premium received. Bought at $50, collected $1.20, breakeven is $48.80.
Return if assigned — max profit divided by capital at risk, annualized. This is the number everyone fixates on because it looks impressive when you annualize a 2-week trade.
These numbers are necessary but not sufficient. They're the "what could happen" without the "should I do this."
What Most Calculators Miss
Here's what actually determines whether a covered call setup is good or bad:
Delta and Distance from Spot
Delta tells you the probability of your call expiring in the money. A 0.30 delta call has roughly a 30% chance of being assigned. A 0.15 delta gives you more room but less premium.
The right delta depends on your intent. If you're OK being assigned (you want to exit the position), a 0.40-0.50 delta is fine. If you want to keep your shares and just collect income, 0.15-0.25 is safer.
Most calculators don't ask what your intent is. They just show the math.
Premium Yield Relative to DTE
Collecting $0.80 on a $50 stock sounds OK until you realize it's a 90-day contract. That's 0.89% per cycle, or about 3.6% annualized. Now compare that to $0.45 on a 14-day contract — that's 0.90% per cycle but annualizes to over 23%.
Raw premium is meaningless without DTE context. What matters is the annualized yield relative to the time your capital is locked up.
Bid-Ask Spread
A contract showing $0.80 mid-price with a $0.60 bid and $1.00 ask has a 50% spread. You'll realistically fill closer to $0.65-0.70, not $0.80. That kills a chunk of your expected yield.
Thinly traded names with wide spreads can turn a seemingly profitable setup into a mediocre one. Spread width as a percentage of the premium is one of the most overlooked metrics in covered call analysis.
Open Interest and Volume
Low open interest means fewer participants and worse fills. It also means rolling will be painful if you need to adjust the position. A contract with 5 open interest and zero volume today is a red flag regardless of what the premium looks like.
Earnings Date
This is the silent killer. If earnings fall inside your DTE window, implied volatility will spike going in and collapse after the announcement. If you sell before earnings, you're collecting elevated premium but taking on binary risk. If earnings are two days before expiry, the post-earnings move could blow through your strike.
A good calculator should flag this automatically. Most don't.
Cost Basis Context
Your cost basis changes everything about how aggressive you should be with strike selection. If you bought at $45 and the stock is at $50, selling the $48 strike means you're still profitable if assigned. If your basis is $55 and the stock is at $50, you probably don't want to sell a call below your entry — assignment locks in a loss.
The calculator should know your basis and factor it into the grade.
Building a Grading System
Instead of staring at raw numbers and trying to weigh all these factors in your head, a grading system evaluates the setup across every dimension and gives you a single score.
Here's the framework:
Premium yield — Is the annualized return worth the capital lockup? Above 20% annualized is strong. Below 8% is weak for most strategies.
Delta — Is it appropriate for your intent? Avoid assignment: stay under 0.25. OK with assignment: 0.30-0.50 is fine.
Spread quality — Is the bid-ask tight enough to get a reasonable fill? Under 10% spread-to-premium is good. Over 25% is a warning.
Open interest — Enough liquidity to enter and exit cleanly? Above 100 OI is comfortable. Below 20 is thin.
Earnings proximity — Are earnings inside the DTE window? If yes, flag it and factor in the added risk.
Distance OTM — How far is the strike from spot? This interacts with your intent and the guardrails you've set.
Each factor gets scored. The scores combine into a letter grade — A+ through F. An A-grade setup has strong yield, appropriate delta, tight spreads, good liquidity, and no earnings landmines. An F means something critical is wrong: maybe the spread is 40% of the premium, or you're selling a 0.60 delta call when your intent is to avoid assignment.
A Mechanical Checklist
Grading is step one. Step two is execution discipline. Before entering any covered call, run through this:
- Intent confirmed — Am I avoiding assignment or OK with it? This determines my strike range.
- Guardrails clear — No earnings inside DTE, sufficient OI, spread under threshold, strike far enough OTM for my rules.
- Grade acceptable — Is the overall grade at or above my minimum? If I only take B+ and above, does this qualify?
- Management plan set — What's my take-profit target? (50% of premium collected is standard.) What triggers a roll? What's my stop?
- Position size check — Does this fit within my portfolio allocation rules?
If any step fails, you don't take the trade. That's what mechanical execution means — the system decides, not your gut.
Putting It Into Practice
Let's say you own 100 shares of a stock at $48.50. It's currently trading at $52.30. You want to sell a monthly covered call to collect income without getting assigned.
You pull up the chain and see the $55 strike, 32 days out, with a $0.85 mid-price.
Running through the framework:
- Premium yield: $0.85 / $52.30 = 1.63% per cycle → ~18.5% annualized. Solid.
- Delta: 0.22. Under 0.25 — matches your "avoid assignment" intent.
- Distance OTM: $55 is 5.2% above spot. Decent buffer.
- Spread: Bid $0.75, Ask $0.95. Spread is $0.20 / $0.95 = 21%. Borderline. You'll likely fill around $0.80.
- Open interest: 850. Plenty of liquidity.
- Earnings: Next report is 45 days out, beyond your 32-day DTE. Clear.
- Cost basis: $48.50 vs $55 strike — if assigned, you'd profit $6.50 + $0.85 premium = $7.35 per share. Fine.
Overall grade: B+. The only knock is the spread width. If the spread were tighter, this would be an A.
Without a systematic framework, you'd have looked at the $0.85 premium, thought "that's decent," and maybe entered the trade. Or maybe not. With the framework, you know exactly where this setup stands and what the weaknesses are.
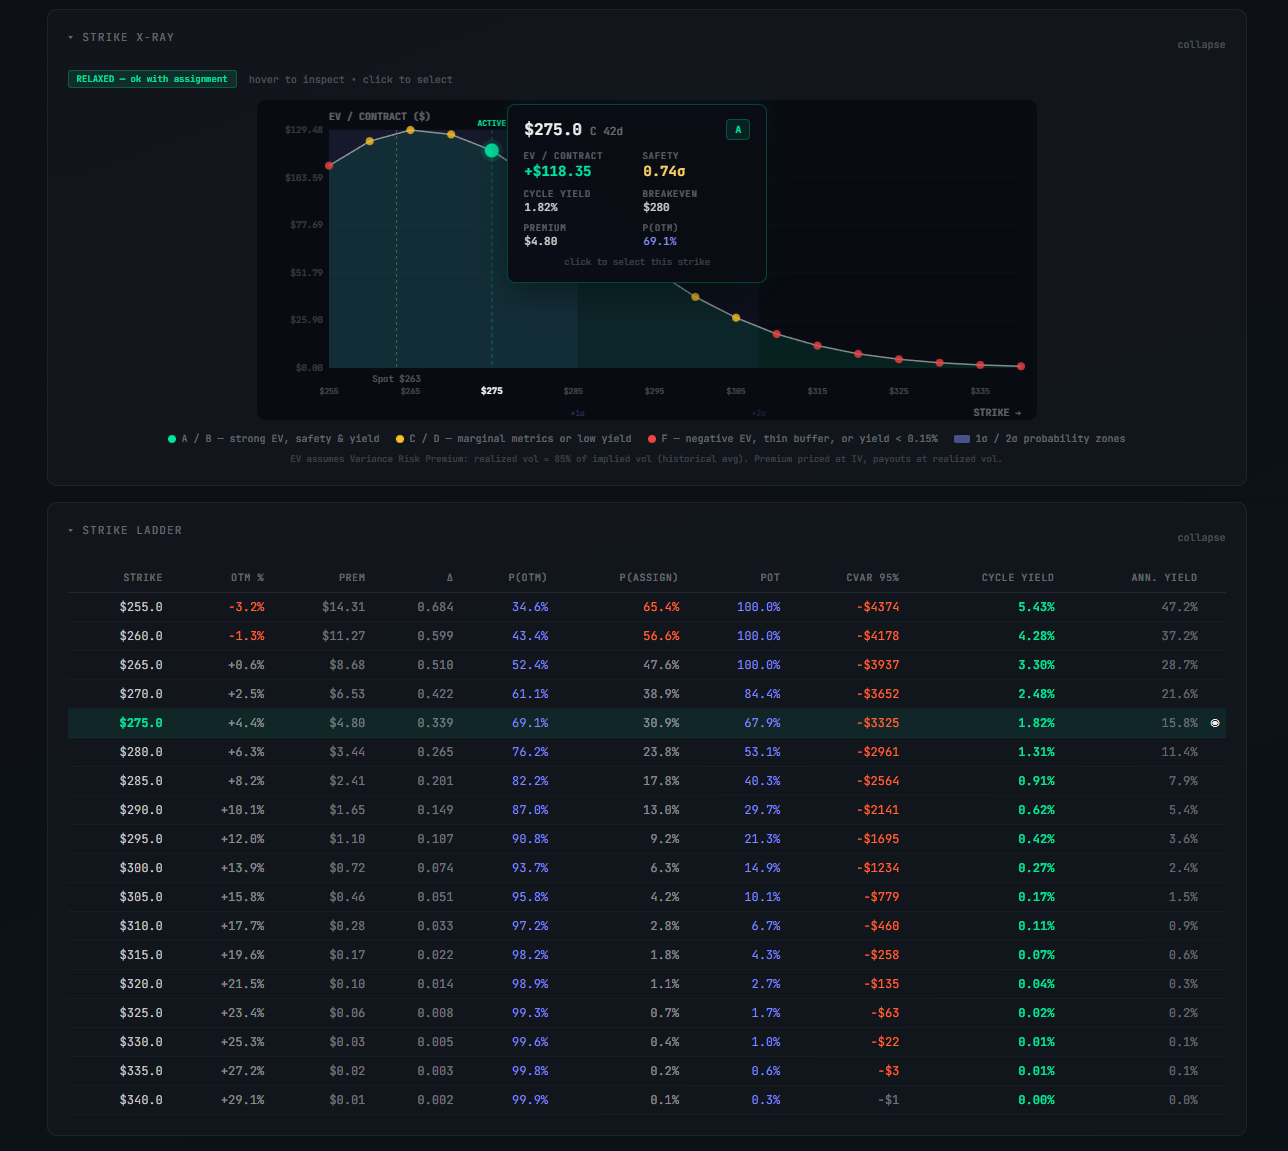
Try It Yourself
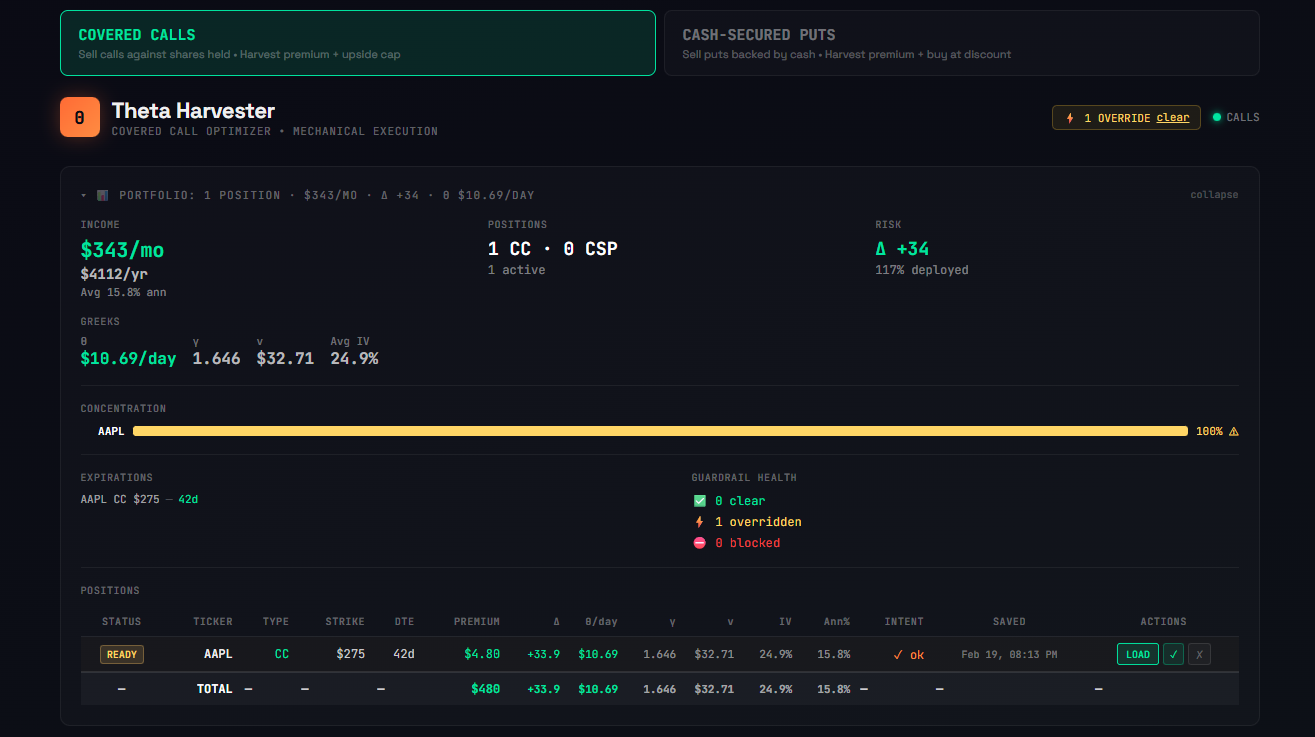
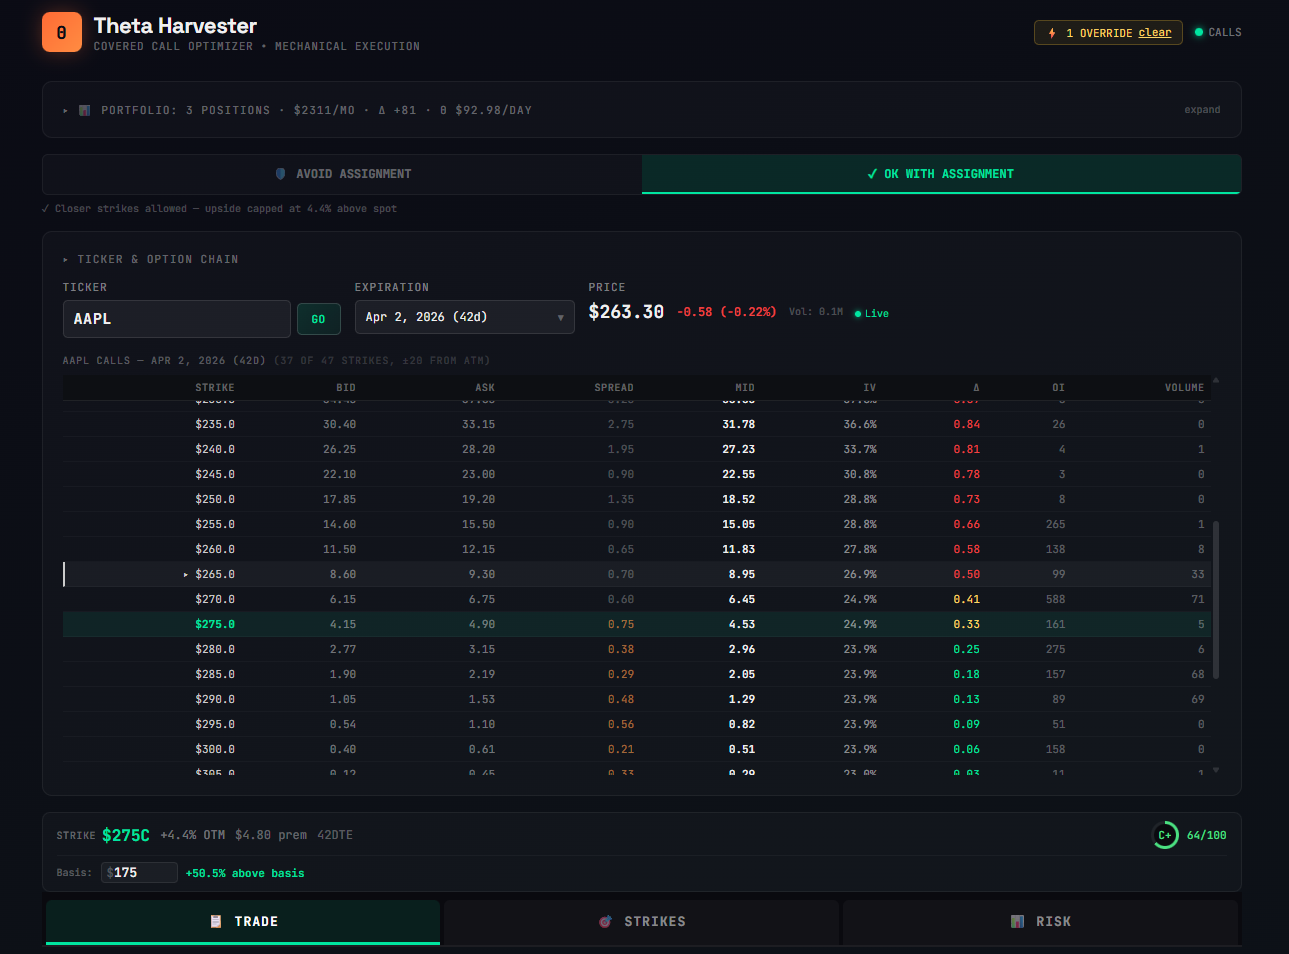
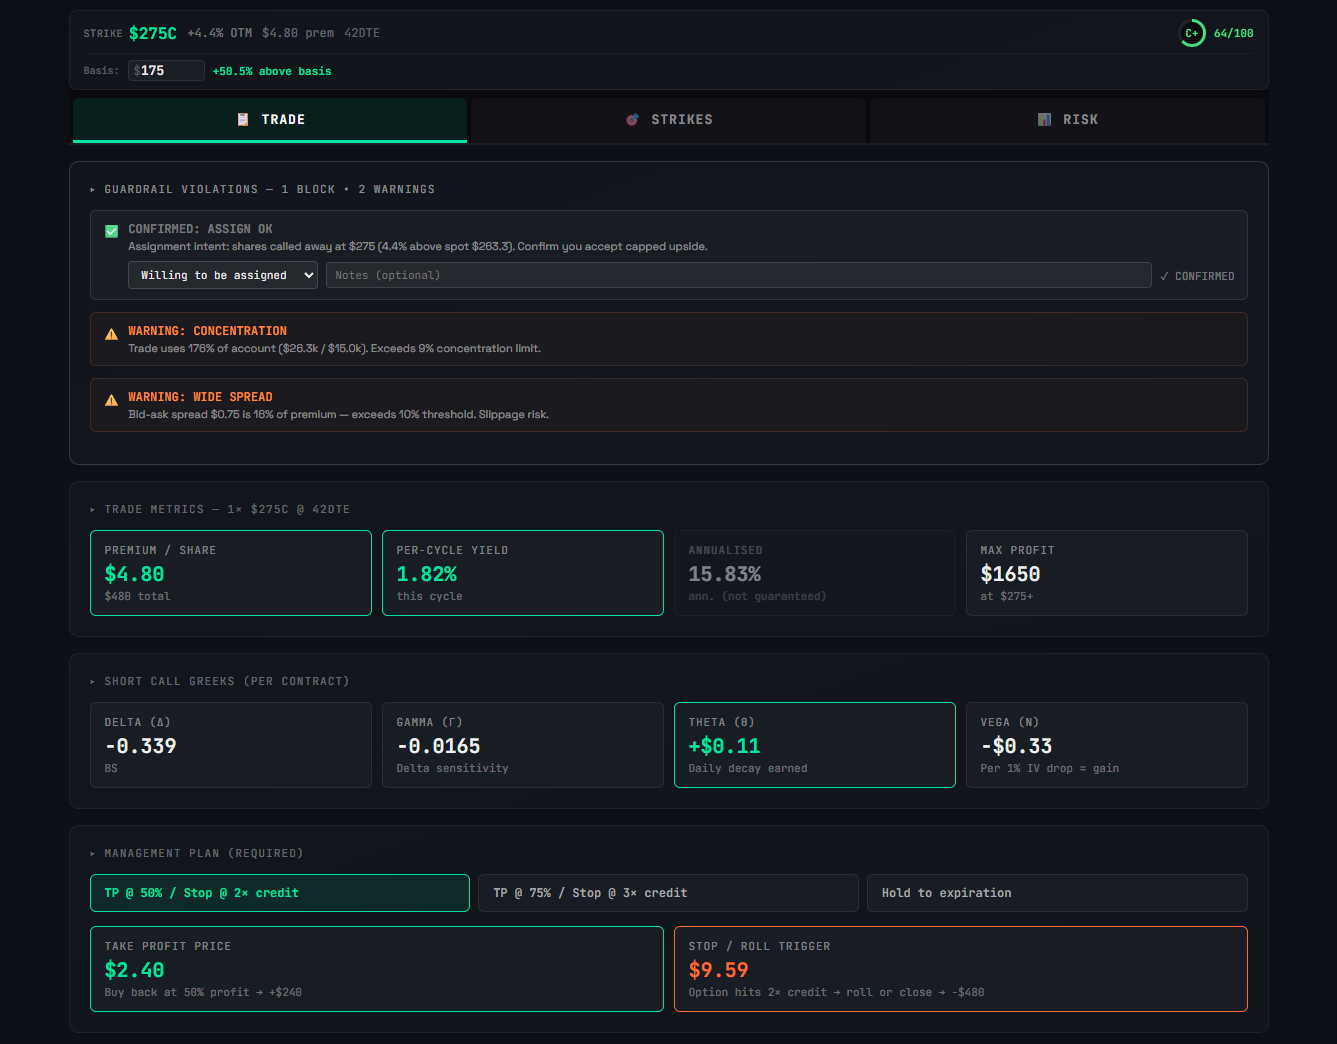
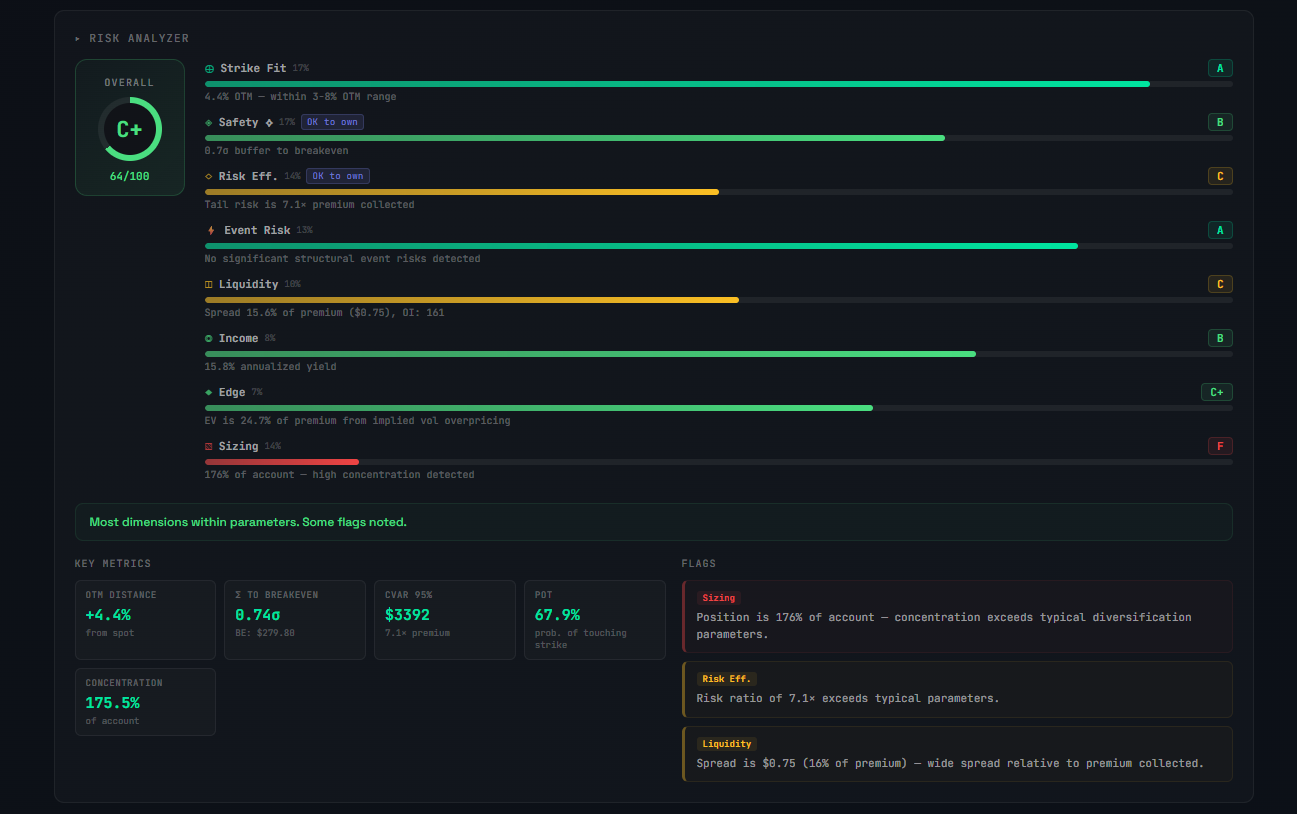
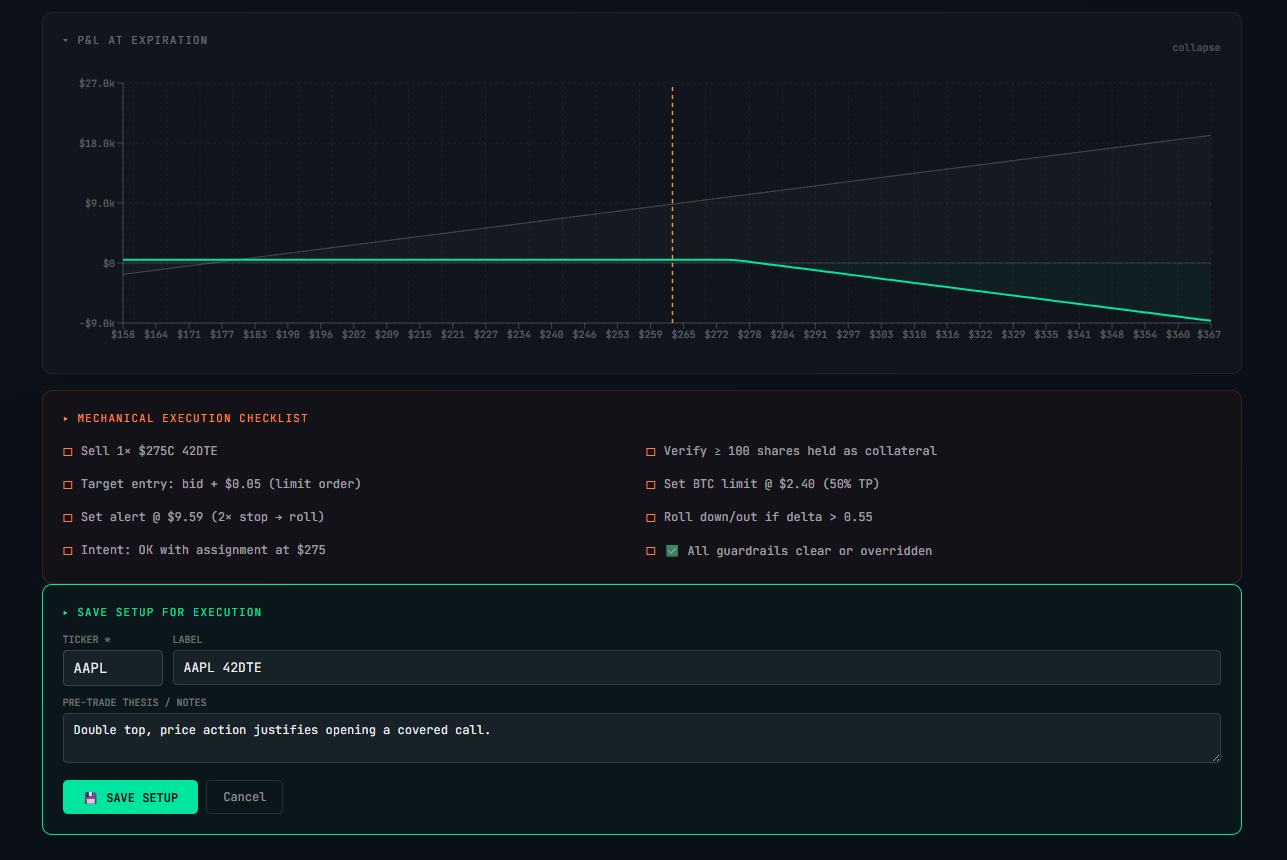
If this framework resonates with how you think about covered calls, have a look at ThetaHarvester. It runs this analysis automatically — you pick a ticker, select a strike from the live options chain, and get a grade with a full breakdown across delta, yield, spread, liquidity, and earnings proximity.
It also generates a management plan with take-profit and roll triggers, and lets you save setups to a portfolio view that tracks aggregate theta and yield across all your positions.
Free users can explore the full tool using demo tickers (AAPL, SPY, TSLA, NVDA, QQQ, MSFT). No signup form — just a magic link to your email.