Realized Volatility Calculator: Know How a Stock Moves
Short answer: Realized volatility is the annualised standard deviation of an instrument's actual past returns. Calculate it from OHLC bars using close-to-close for simplicity or Yang-Zhang for accuracy, then use the result to size stops and place short strikes outside the instrument's normal range.
Implied volatility tells you what the market expects. Realized volatility tells you what actually happened.
If you sell premium, you need both — because the difference between them is where the money comes from. And if you set stops, you need the second one specifically, because a stop is a bet about an instrument's normal range, and most traders place it using a round number rather than a distribution.
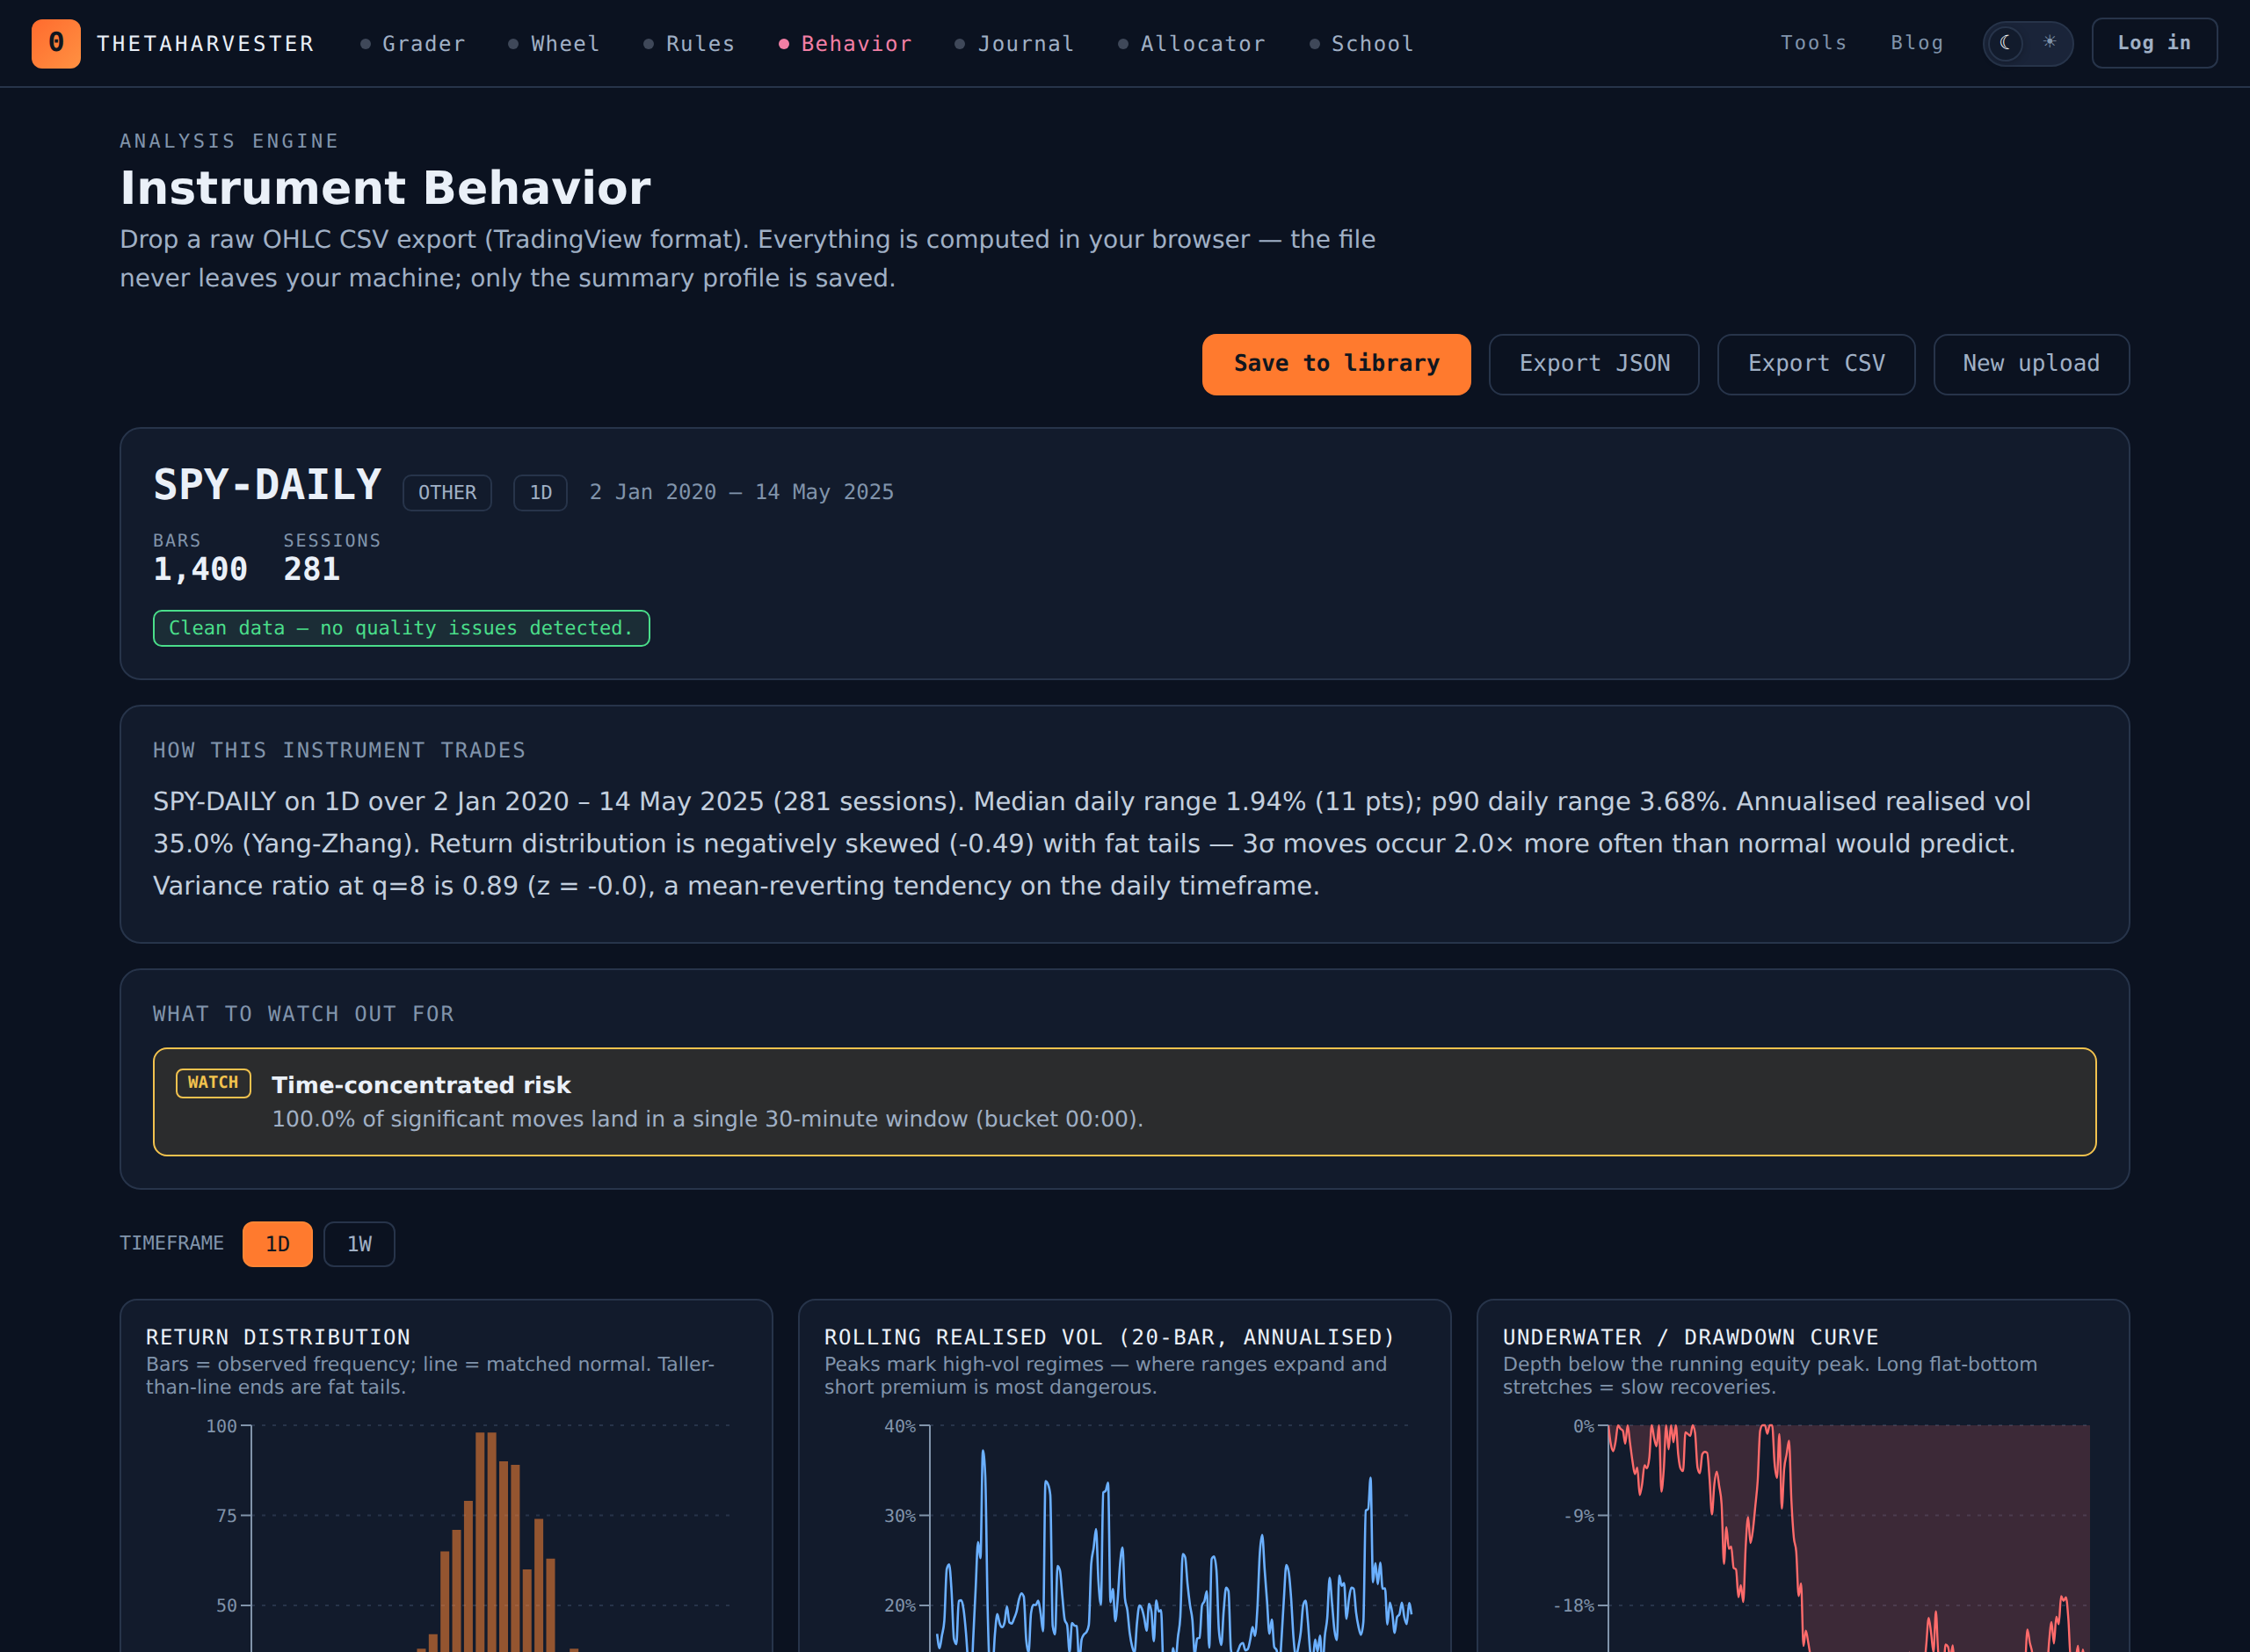
The Instrument Behavior Engine takes a CSV of OHLC bars and returns the full statistical profile of how that instrument moves.
Two ways to measure realized volatility, and when each is wrong
Realized volatility is the annualised standard deviation of past returns. There is more than one way to compute it, and the choice matters more than most traders expect.
Close-to-close: simple, and blind to everything intraday
The standard method takes the standard deviation of daily log returns from close to close and annualises it. It is easy to compute and easy to explain.
It also throws away three of the four prices in every bar. An instrument that opens at 100, trades down to 94, back up to 106 and closes at 100 registers as a zero-return day. Close-to-close will tell you that day was quiet. Anyone holding through it knows otherwise.
Yang-Zhang: uses the whole bar
The Yang-Zhang estimator combines three components — overnight (previous close to open), opening (open to close), and Rogers-Satchell intraday drift — into a single figure. It handles opening gaps and it is unbiased in the presence of drift.
The practical consequence: it is far more statistically efficient. It extracts more information from the same number of bars, so it reacts faster and needs a shorter window to be trustworthy.
Why the same stock shows 22% on one and 31% on the other
Because the two estimators are measuring different things. A large gap between them is itself a signal: it says this instrument does most of its moving inside the session, and a strategy that only ever looks at closing prices is going to be repeatedly surprised by it.
The engine computes both, so you can see the spread rather than pick one and hope.
The return distribution: what "normal" looks like for one instrument
The average daily move is a nearly useless number. Returns are not normally distributed — they have fat tails and usually some skew — so the mean tells you very little about what a bad day looks like.
Percentiles do. The engine reports the full distribution of returns with percentile breakpoints, so you can answer questions in the form that actually matters: how often does this thing move more than 3% in a day, and when it does, what does the day after look like?
Volatility is a regime, not a constant
A single annualised number hides everything interesting. Volatility clusters: quiet periods follow quiet periods, and a shock raises volatility for days or weeks afterwards.
The rolling volatility series shows the regime you are actually in, not the average of the last two years. Selling a 30-day option into the bottom decile of an instrument's own volatility range is a materially different trade from selling the same strike in the top decile, even at the same implied volatility.
Drawdown and the underwater curve
Maximum drawdown is one number and it hides the thing that decides whether a position is survivable: duration.
The underwater curve plots how far below the prior peak the instrument sat at every point in history. A 20% drawdown that recovers in three weeks and a 20% drawdown that takes fourteen months are the same number and completely different experiences — and if you might be assigned the shares, the second is the one that matters.
Gaps, sessions and day-of-week behaviour
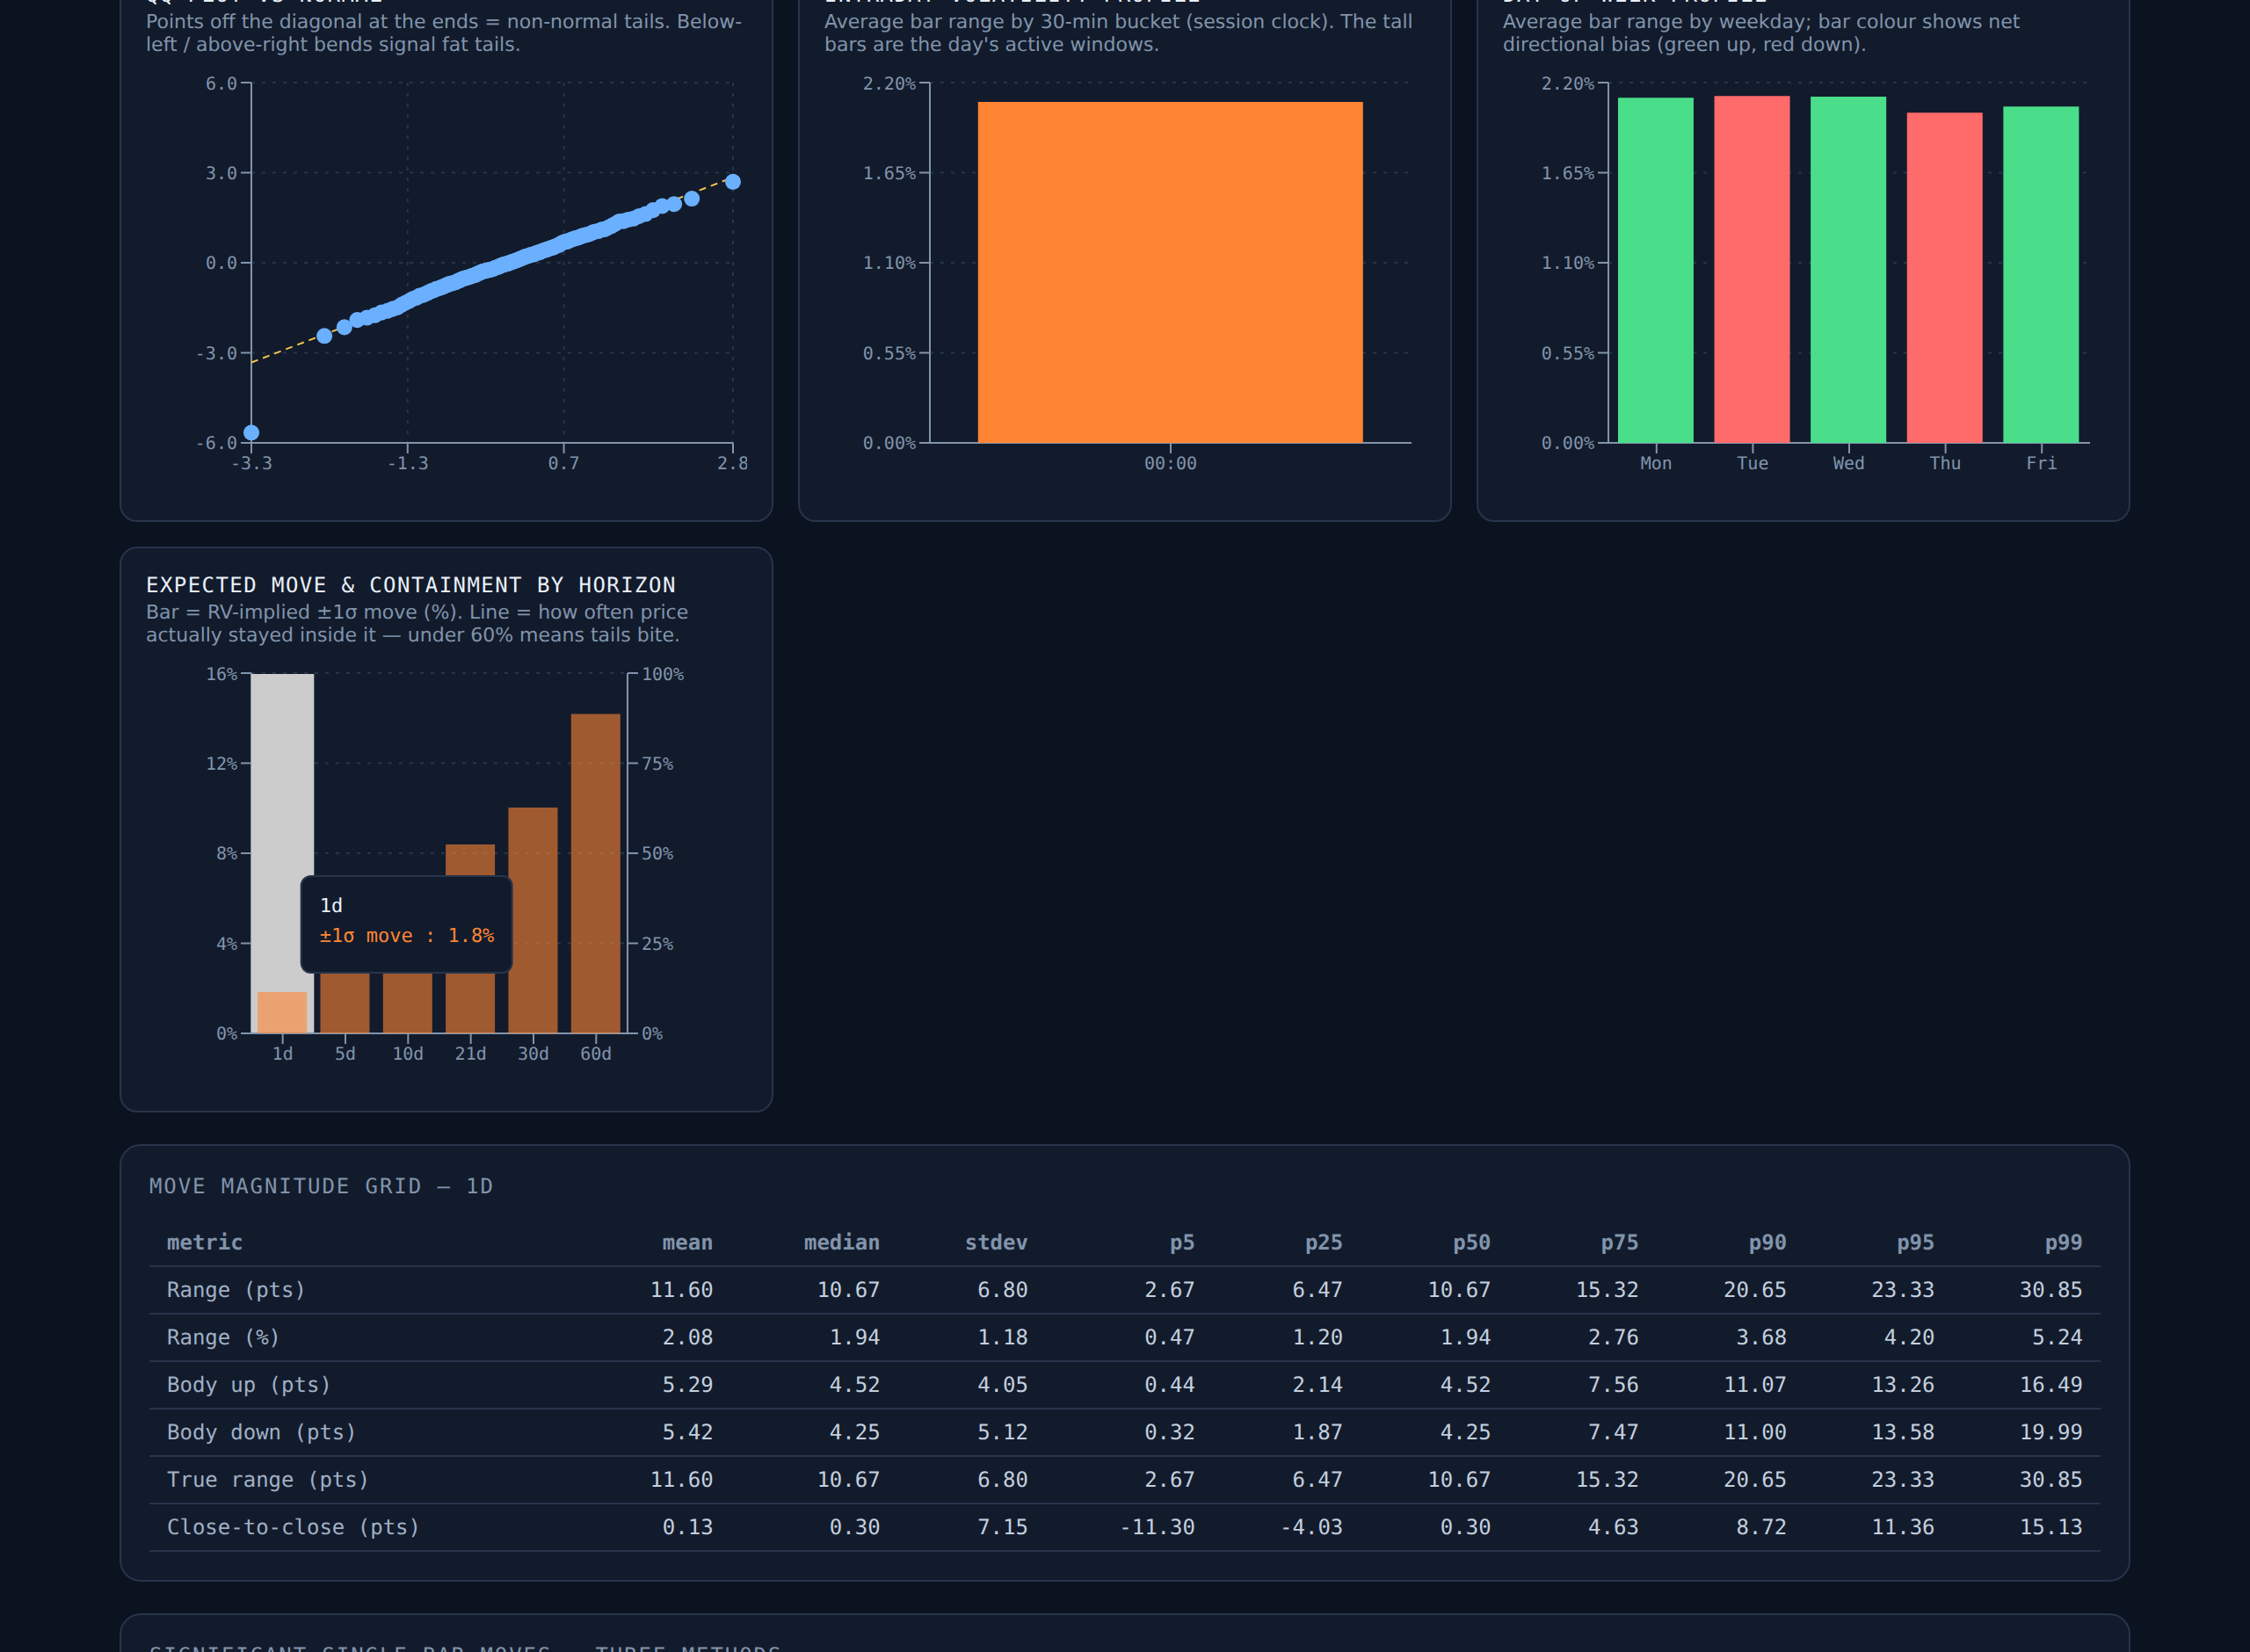
The engine classifies every bar boundary — contiguous, session break, weekend, holiday, or genuine data gap — and reports the overnight gap distribution separately from intraday movement.
This is the analysis that decides whether a stop is meaningful. If an instrument regularly gaps 3% overnight, a 2% intraday stop is not protecting you from anything; it is guaranteeing you exit at the open on a bad day, at whatever price is available.
Session profiles and day-of-week statistics are reported as descriptive statistics, not signals. Knowing that this instrument's widest ranges cluster in the first ninety minutes is useful for placing an order. It is not a strategy.
Persistence versus mean reversion
Does a large move in this instrument tend to continue, or revert?
The engine measures autocorrelation and persistence directly. The answer should change your management rules rather than your entries: an instrument that reverts after a shock deserves a wider stop and more patience, while one that trends after a shock deserves the opposite.
Building an expected-move table without an options chain
The one-standard-deviation expected move over a horizon is:
price × volatility × √(days / 365)
For a $100 stock with 25% annualised volatility over 30 days, that is 100 × 0.25 × √(30/365) ≈ $7.17, covering roughly 68% of outcomes.
Every expected-move calculator on the web derives this from live implied volatility, which means you need an options chain and reasonable liquidity. Deriving it from the instrument's own realized behaviour needs neither, and it answers a different question: not what is the market pricing, but what has this thing actually done.
Compare the two and the divergence is the trade. When the implied expected move is much wider than the realized one, premium is rich. When it is narrower, the market is underpricing this instrument's real range and selling is a worse deal than the headline IV suggests.
Setting stops from a distribution instead of a round number
An "8% stop" is arbitrary. It is the same number whether the instrument routinely moves 1% a day or 6%.
A stop placed outside the 90th percentile of this instrument's daily range over your intended holding period is a defensible one, because it is derived from how the thing actually behaves. Anything tighter than the median adverse excursion is not a stop at all — it is a coin flip with a commission attached.
This is also the join that makes the Trade Journal stop analytics work: it compares every stop you actually used against this instrument's reference distribution, and counts how many of your stop-outs were noise rather than thesis failures.
What you need to upload
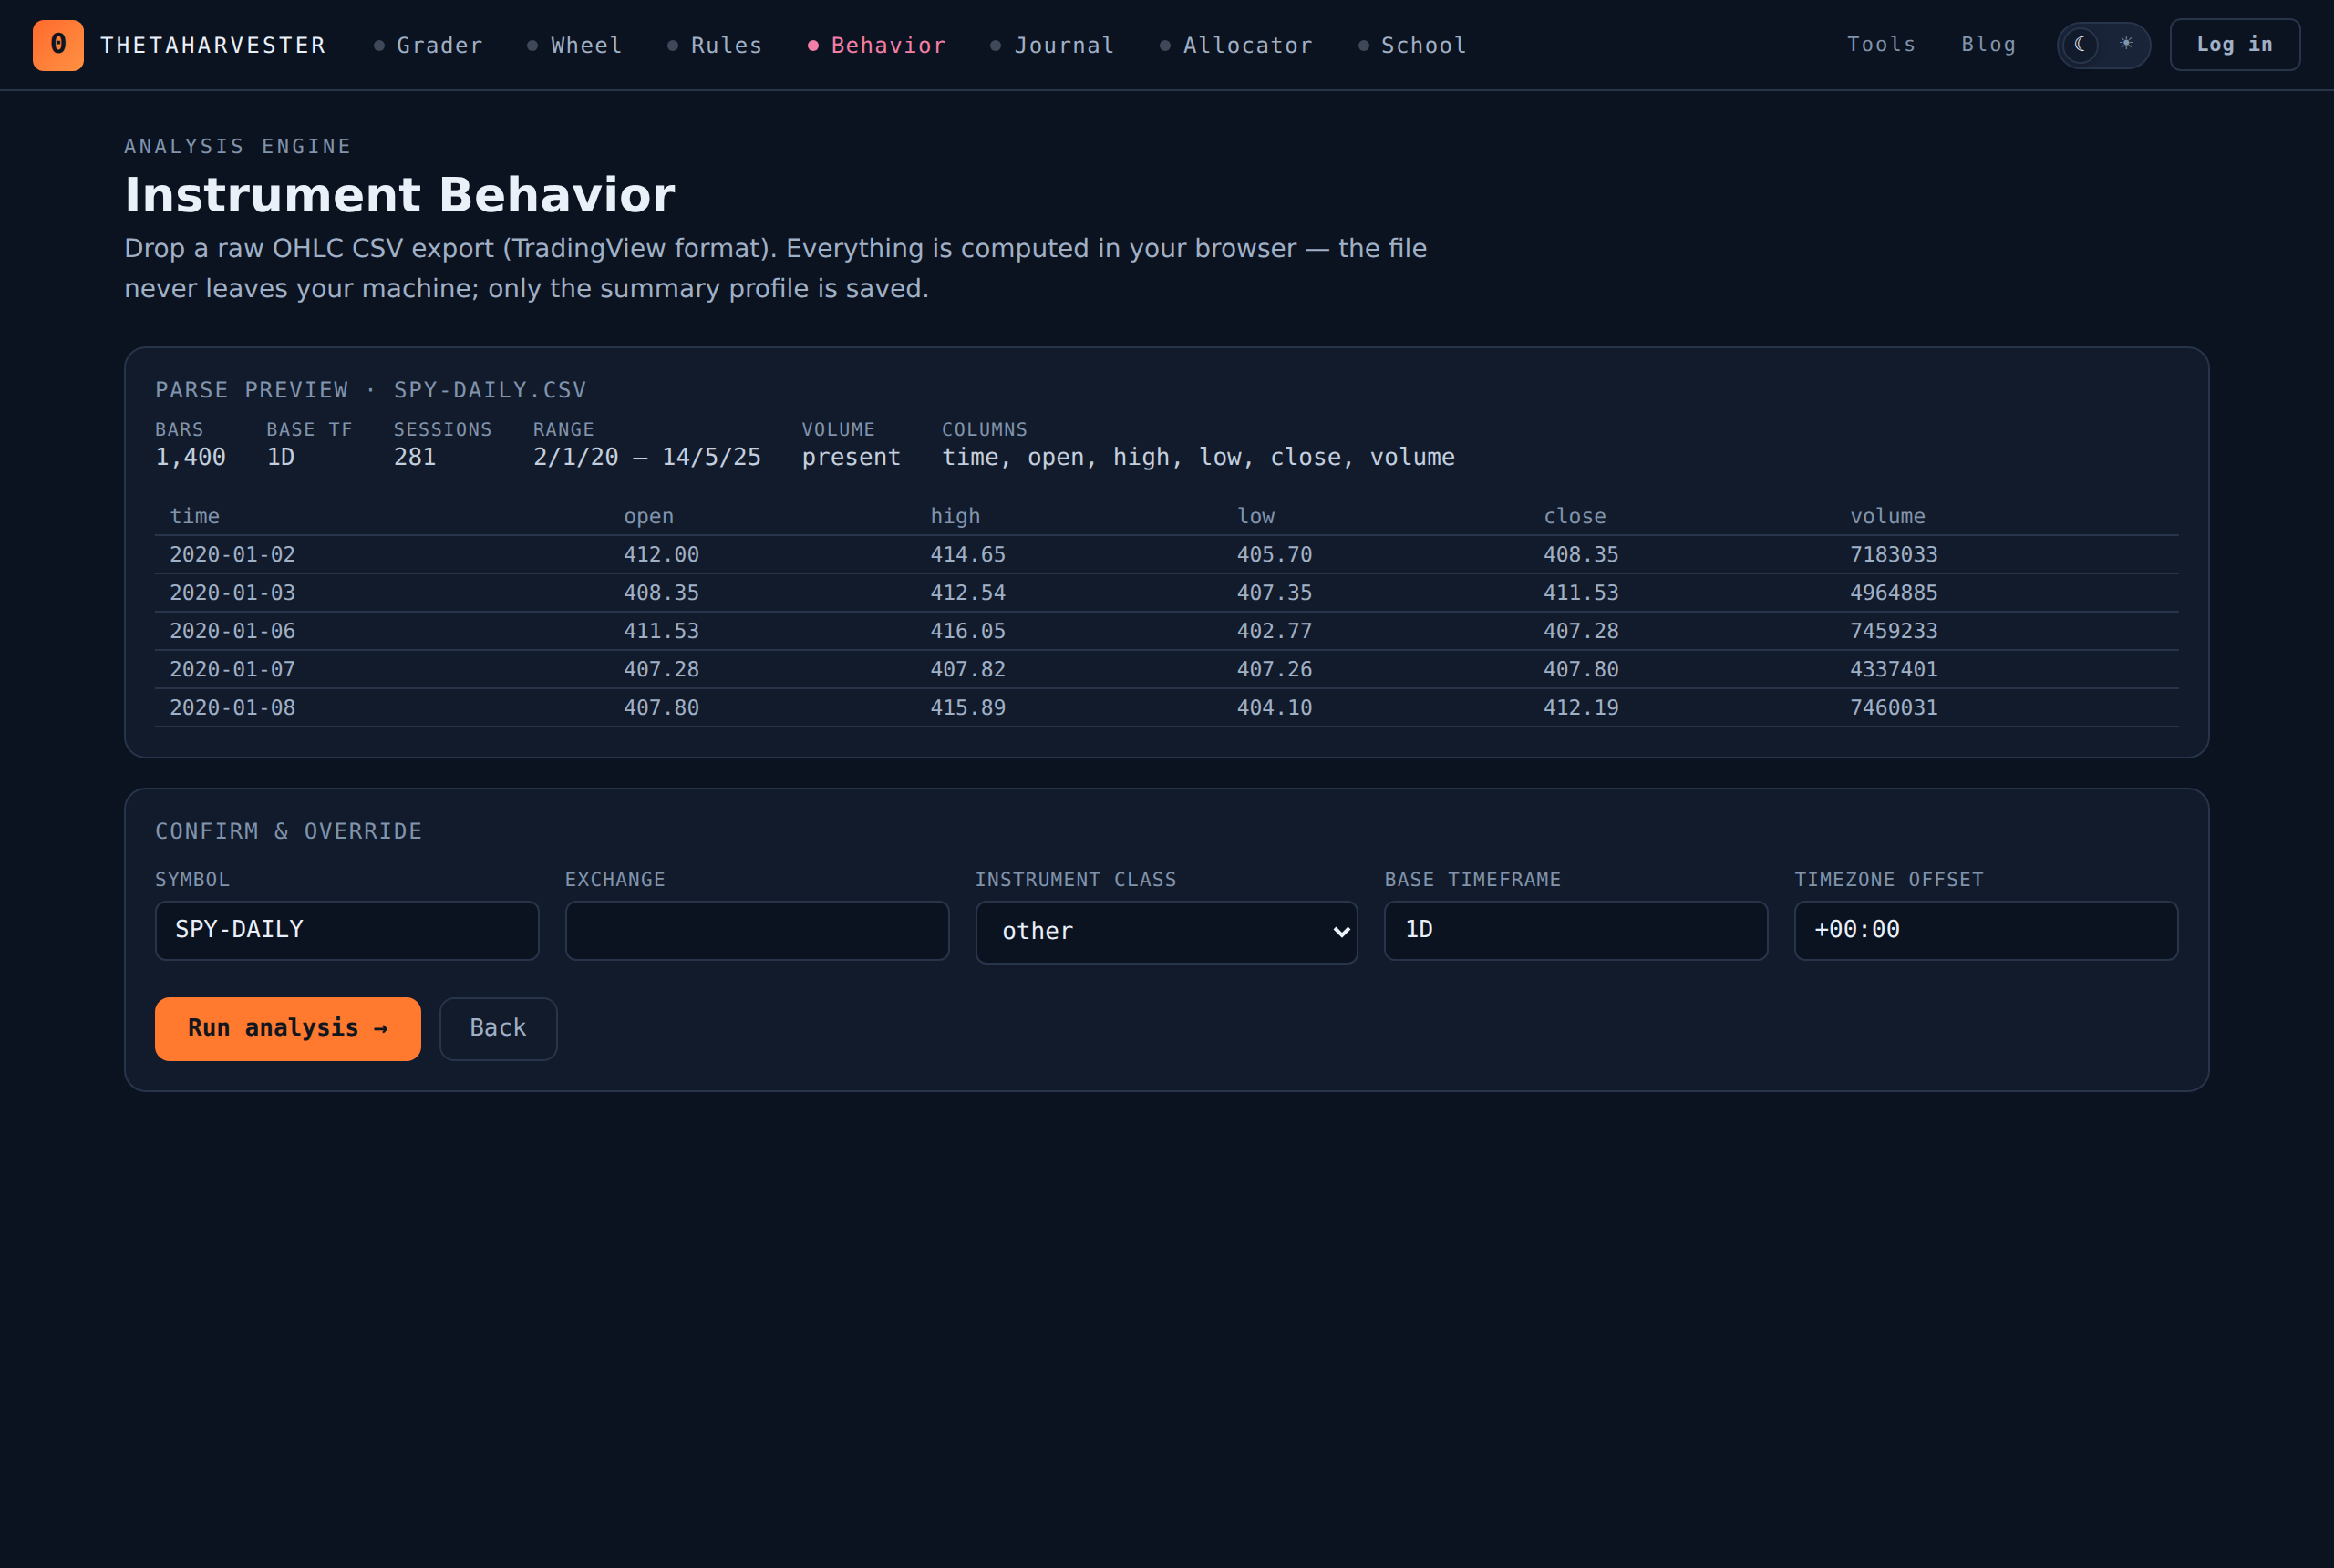
A standard OHLC export: one row per bar, with date, open, high, low and close. Volume is optional. Files from most brokers, Yahoo Finance and TradingView work directly, and the engine detects the timeframe and timezone offset itself, resampling into higher frames as needed.
Everything is computed in your browser. The raw bars are never uploaded to a server — only the summary profile is stored, and only if you save it.
Upload a CSV to the Instrument Behavior Engine and find out what your instrument's normal actually looks like.
Frequently asked questions
What is realized volatility?
Realized volatility, also called historical or statistical volatility, is the annualised standard deviation of an instrument's actual past returns over a chosen lookback window. It measures what a price did, in contrast to implied volatility, which is derived from option prices and reflects what the market expects it to do.
What is the Yang-Zhang volatility estimator?
Yang-Zhang is a volatility estimator that uses the full open, high, low and close of each bar rather than closing prices alone. It combines overnight, opening and intraday components, which makes it more statistically efficient than close-to-close volatility and lets it handle both opening gaps and price drift.
Why does Yang-Zhang volatility differ from close-to-close volatility?
Close-to-close volatility ignores everything that happens inside the trading day, so it understates instruments with wide intraday ranges that close near their open. Yang-Zhang captures that intraday movement and typically produces a higher and more stable estimate for such instruments.
How do you calculate expected move from realized volatility?
Multiply the current price by the annualised volatility, then by the square root of days divided by 365. For a $100 stock with 25% volatility over 30 days: 100 × 0.25 × √(30/365) ≈ $7.17. That is the approximate one-standard-deviation range, covering roughly 68% of outcomes.
Is implied volatility usually higher than realized volatility?
Most of the time, yes. Implied volatility typically trades above subsequently realized volatility, and that gap is known as the volatility risk premium. It is the structural reason systematic option-selling strategies can be profitable.
How much does a stock move in a normal day?
It depends entirely on the instrument. A broad index typically moves 0.5% to 1.0% on a normal session, while individual stocks routinely move several times that and can move 5-20% on earnings. This is why a per-instrument distribution is more useful than any market-wide average.
What is an underwater curve?
An underwater curve plots how far below its prior peak an instrument sits at every point in time. Unlike a single maximum-drawdown figure, it shows both how deep declines went and how long recovery took — and the duration is usually what determines whether a position is actually holdable.
What CSV format do I need to analyse an instrument's behaviour?
A standard OHLC file with one row per bar and columns for date, open, high, low and close. Exports from most brokers, Yahoo Finance and TradingView work directly, and the same format supports daily, hourly or intraday bars.
Should I use realized or implied volatility to pick option strikes?
Use both. Implied volatility prices the option and defines the market's expected move; realized volatility tells you whether that expectation has historically been too wide or too narrow for this instrument. Selling is most attractive when implied sits meaningfully above the instrument's typical realized volatility.
How do you set a stop loss using volatility instead of a fixed percentage?
Set the stop beyond the instrument's normal noise using its own distribution — for example outside the 90th percentile of daily range, or a multiple of average true range. A fixed percentage stop ignores the fact that a 5% move is routine for one instrument and extreme for another.