Stock Fundamentals Checklist: How to Grade Any Ticker
Short answer: A stock fundamentals checklist should cover four categories: valuation, profitability, growth and momentum. Score each metric against sector peers rather than absolute thresholds, because a 12x price/earnings ratio is expensive for a regional bank and cheap for a software company.
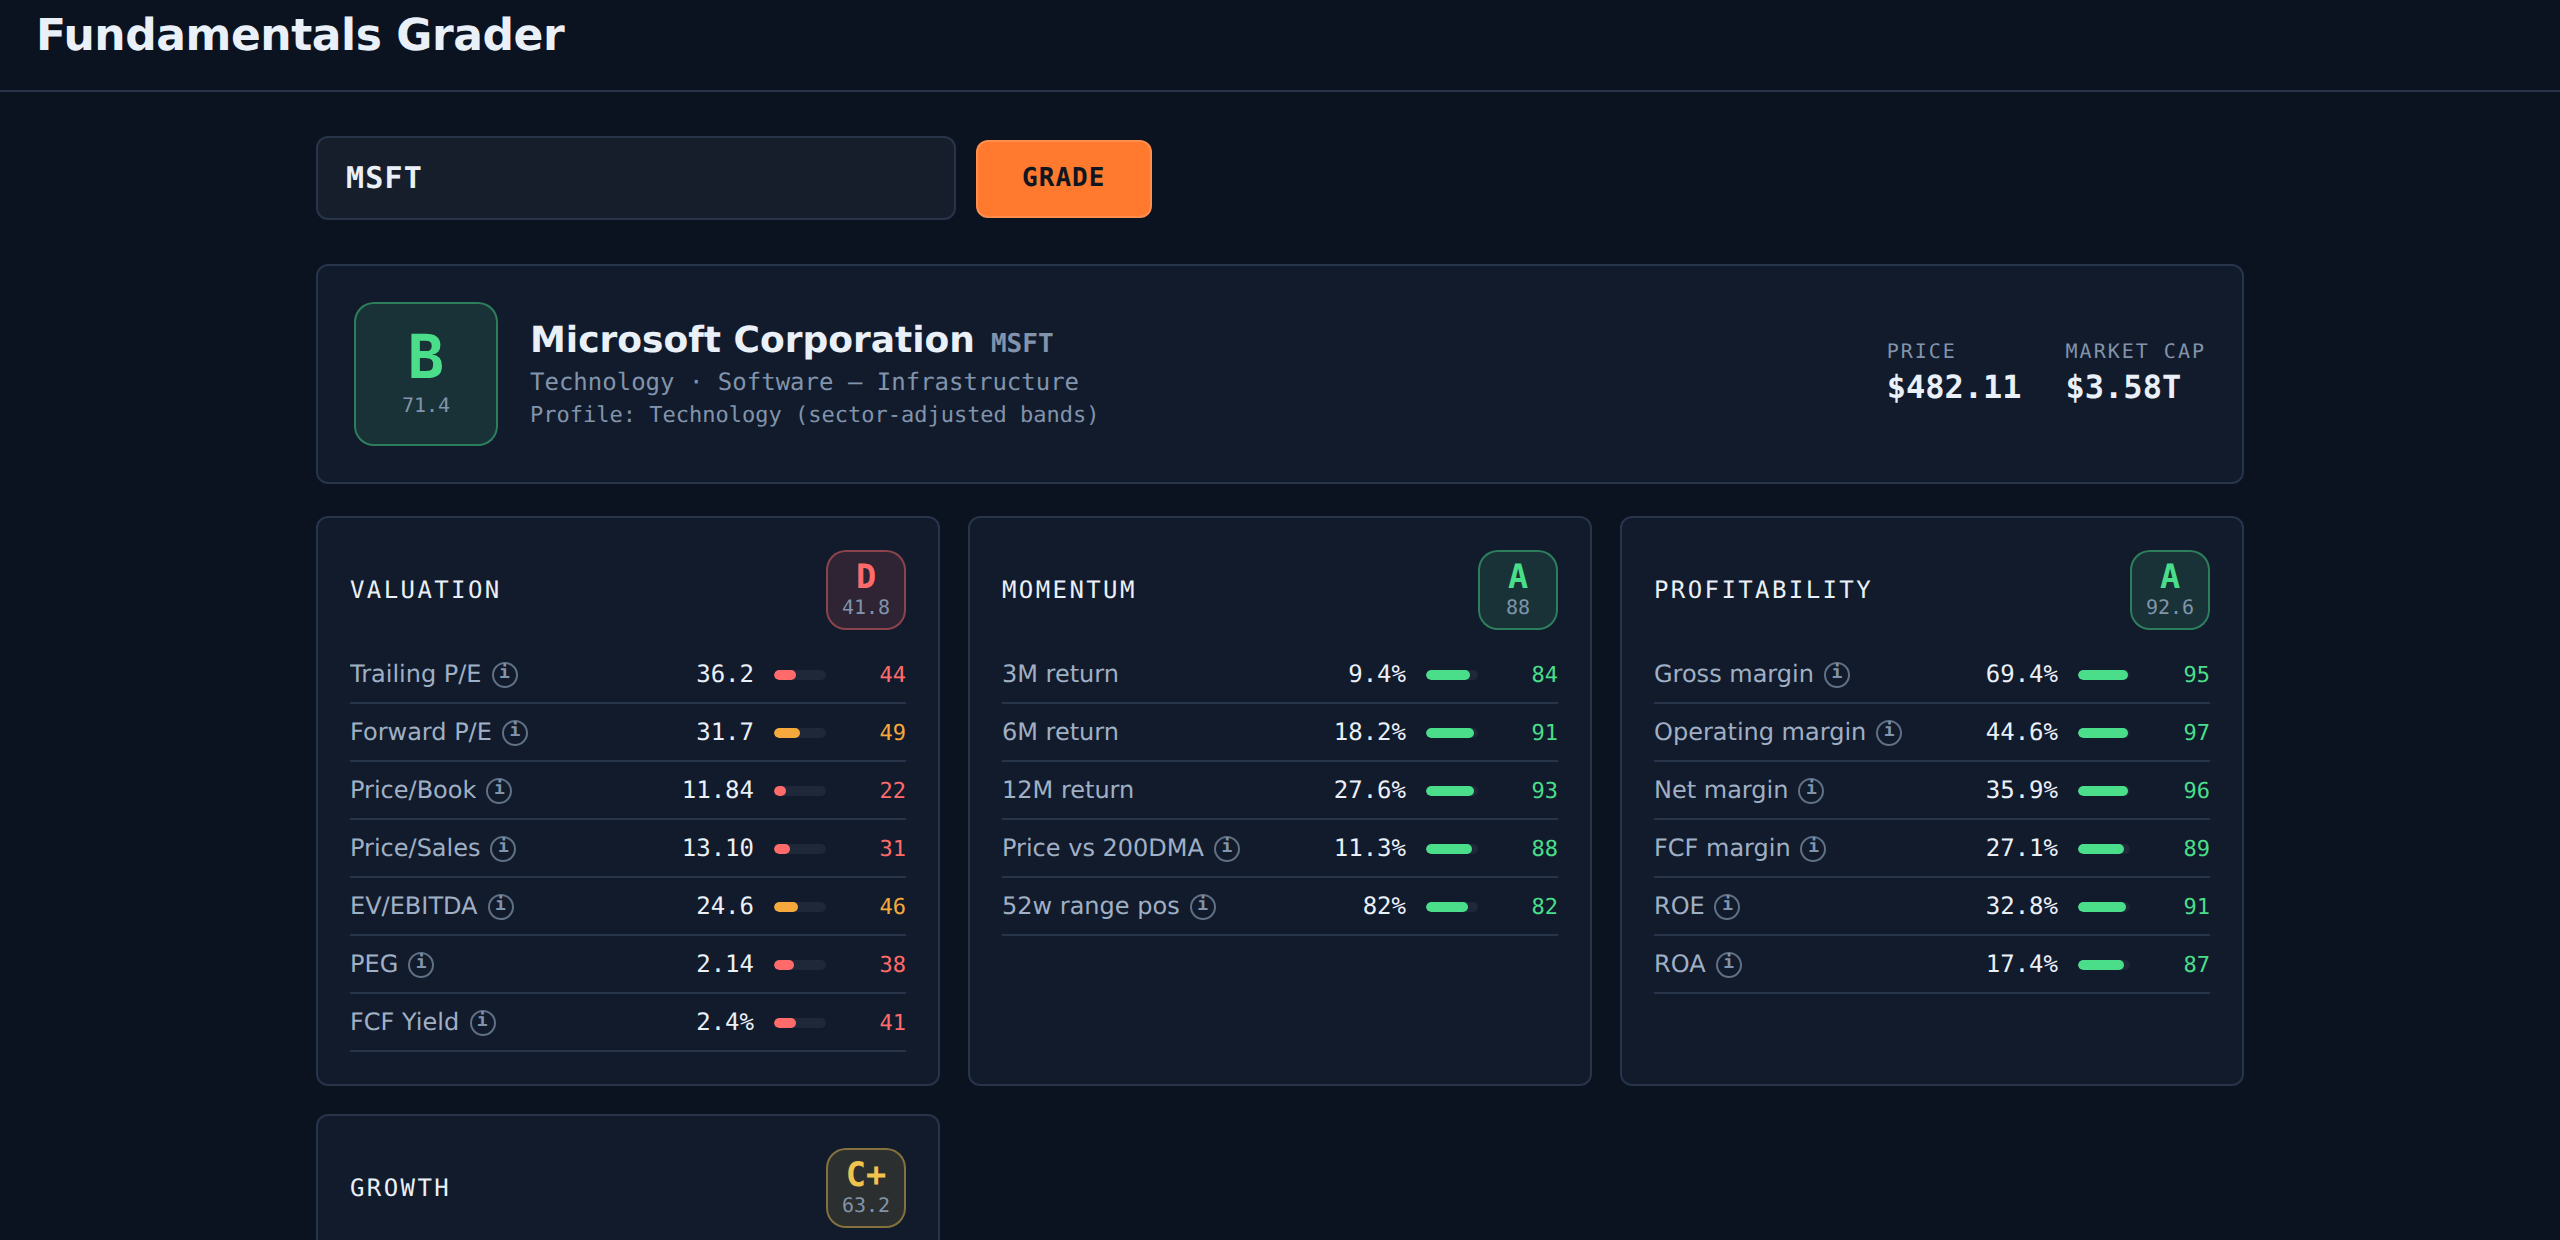
There are roughly twenty numbers worth checking before you own a stock, they live in four different places on most finance sites, and every one of them is meaningless without knowing what normal looks like for that industry.
That is the job the Fundamentals Grader does. Type a ticker, get a report card: an overall letter grade and a 0-100 score, four category grades, and every underlying metric scored against its sector peers.
The four questions a fundamentals check has to answer
Valuation — what am I paying relative to what I get?
Trailing and forward P/E, price/book, price/sales, EV/EBITDA, PEG, and free cash flow yield.
Valuation is the category most people check first and interpret worst, because every one of these ratios is only meaningful against a peer group.
Profitability — does the business survive a bad year?
Gross, operating, net and free cash flow margins, plus return on equity and return on assets.
Margin is what determines whether a downturn is a bad quarter or an existential problem. A company converting 27% of revenue into free cash has options; one converting 2% does not.
Growth — is the story intact or decaying?
Revenue year-over-year, three-year revenue CAGR, EPS growth and free cash flow growth.
The most useful signal here is usually a divergence: free cash flow decelerating while revenue still looks healthy is one of the more reliable early warnings that something has changed.
Momentum — is the market already voting against this?
Three, six and twelve-month returns, price versus the 200-day moving average, and position within the 52-week range.
Momentum is not a fundamental, but it belongs on the checklist because it tells you whether the market currently agrees with your fundamental read. Disagreement is not automatically wrong. It is information about timing.
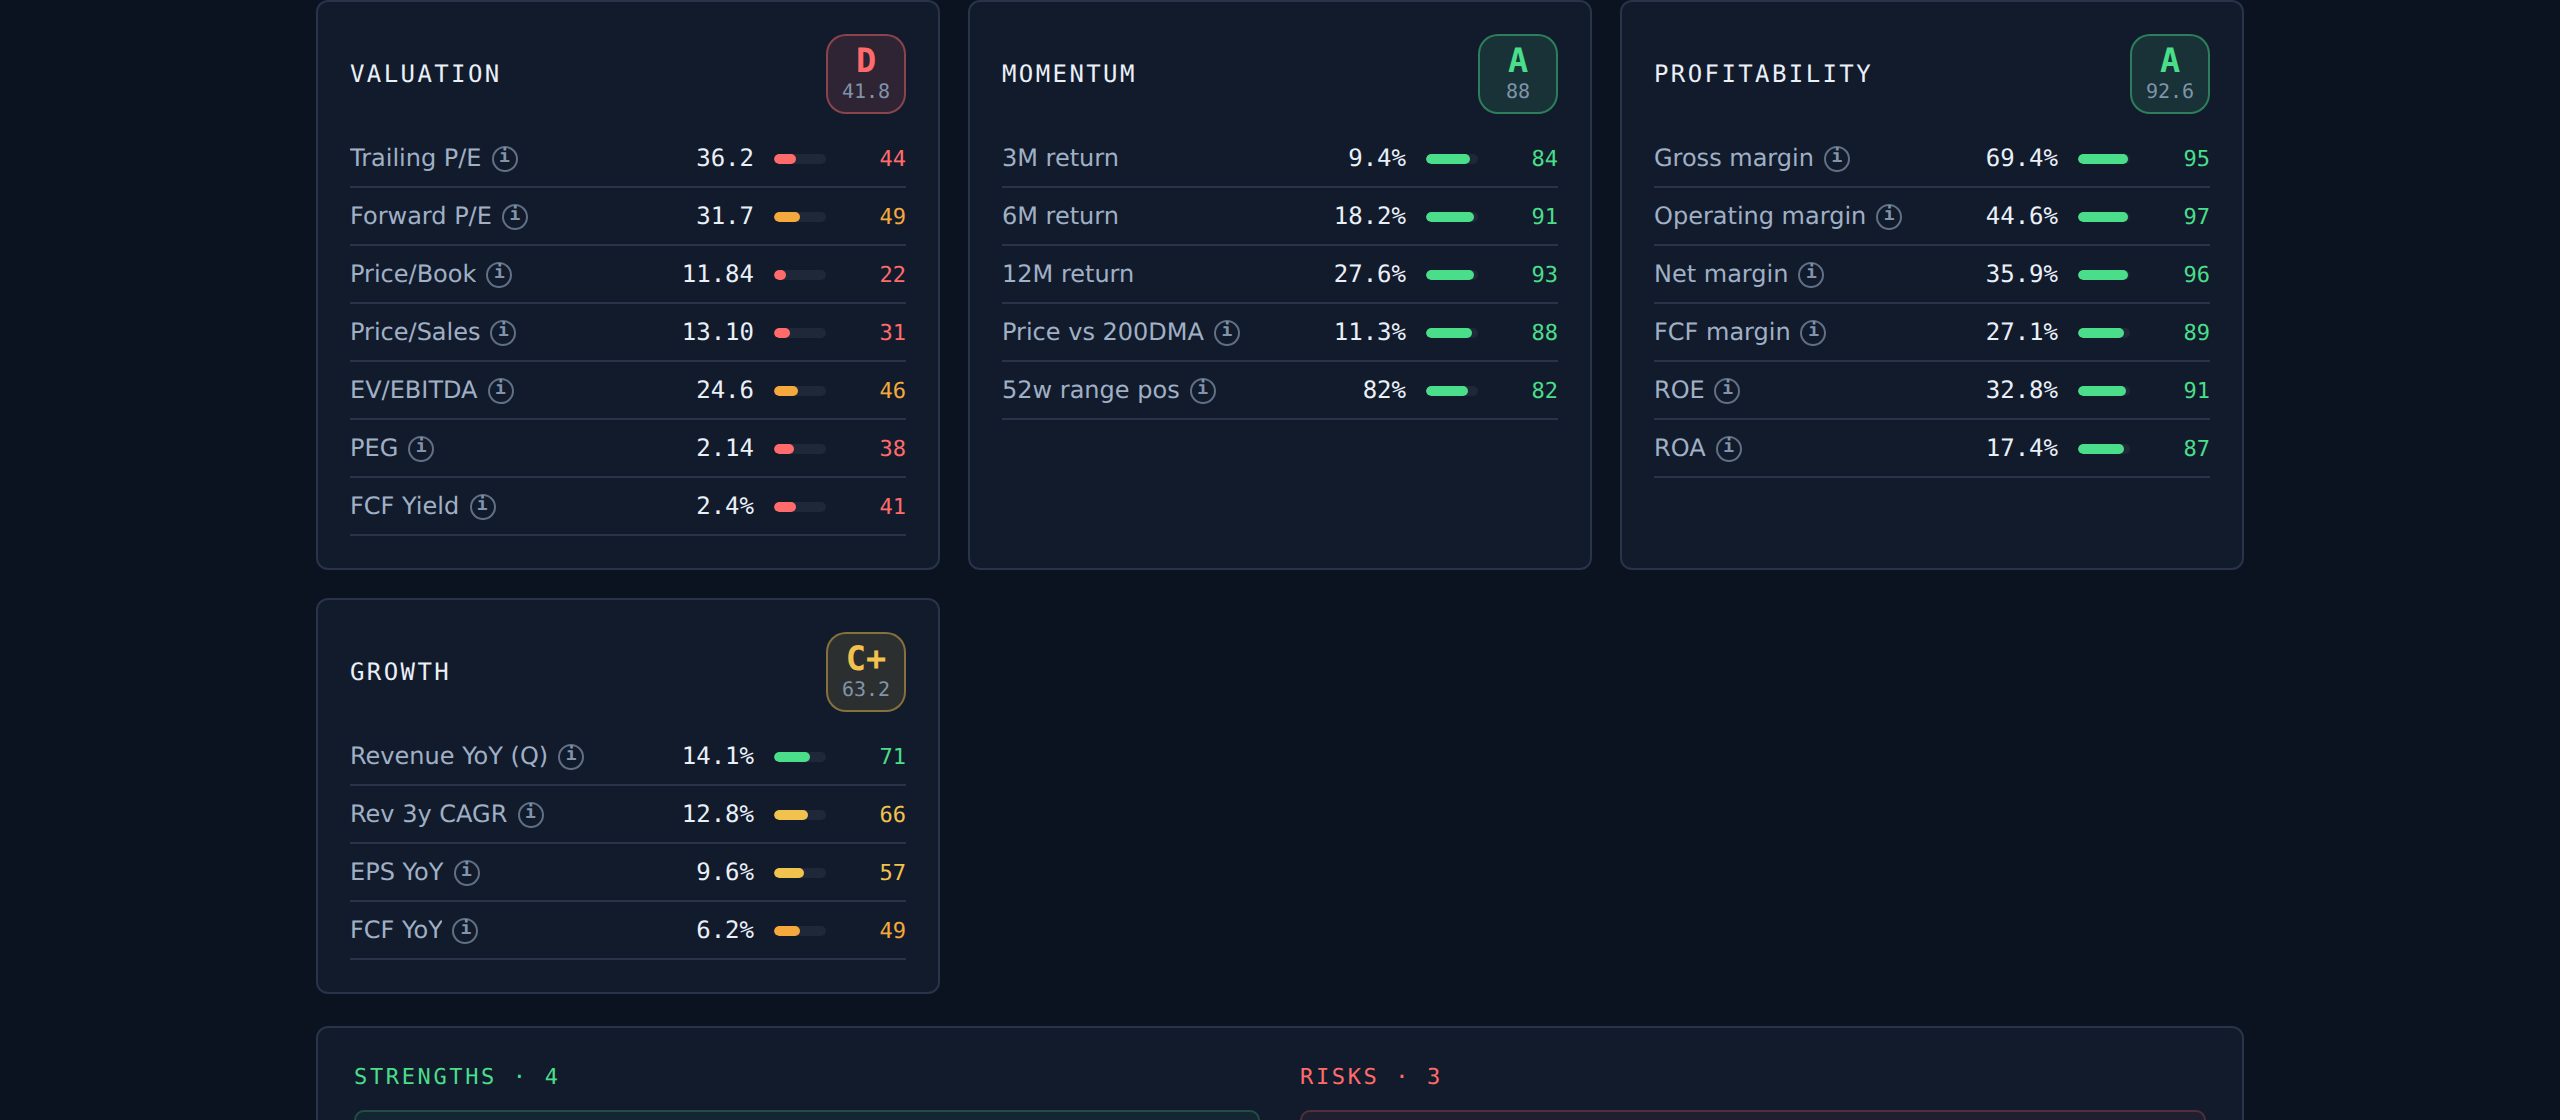
Each metric gets its own 0-100 sub-score and a colour band, so you can see which specific number dragged a category down rather than just the aggregate.
Why raw multiples lie, and what sector adjustment fixes
This is where most stock graders quietly go wrong, and it is the part worth understanding even if you never use one.
A 30x P/E is unremarkable for enterprise software and alarming for a utility. A price/book of 11 is normal for an asset-light business with almost no balance sheet, and absurd for a bank — where book value essentially is the business. Score those against a single absolute threshold and you produce a grader that systematically prefers banks and insurers to software companies, not because they are better businesses but because the yardstick was wrong.
The grader scores every metric against sector-adjusted bands. The report names the profile it applied — "Profile: Technology (sector-adjusted bands)" in the header above — and where a metric is genuinely not meaningful for a sector, it is marked "n/a (sector)" rather than scored against an irrelevant benchmark.
The result is a grade that means good relative to its peers, which is the only version of the question that helps you choose between two candidates.
Turning twenty metrics into one decision
Sub-scores roll up into category grades, and category grades into an overall letter and score.
The example above grades MSFT at B (71.4): an A in profitability and momentum, a C+ in growth, and a D in valuation. That spread is the useful part — it says excellent business, priced like everyone already knows it.
A single letter is a starting point, not a verdict. What you do with it depends on how you actually take positions.
Reading the grade for how you trade
If you are buying and holding, the profitability and growth categories carry the most weight, and a weak valuation grade is a question about entry timing rather than about the business. A high grade with a poor valuation score is a watchlist candidate, not a rejection.
If you are swing trading, momentum and valuation matter more than three-year CAGR, because your holding period will not span the thesis. A strong fundamental grade mainly buys you protection against the position going badly wrong while you are in it.
If you are selling puts or running the wheel, the grade is doing something more specific: selling a cash-secured put obligates you to buy the stock, so the screening standard is the same one you would apply to buying it outright. "High implied volatility equals good trade" is the most expensive shortcut in options income — elevated IV is the market pricing a large expected move, and it is usually right about the size even when wrong about the direction. A weak grade with rich premium is a warning, not a gift.
If you are already assigned or holding, the grade answers a different question: is this still worth owning, or is a deteriorating position being defended out of habit?
Strengths and risks, stated explicitly
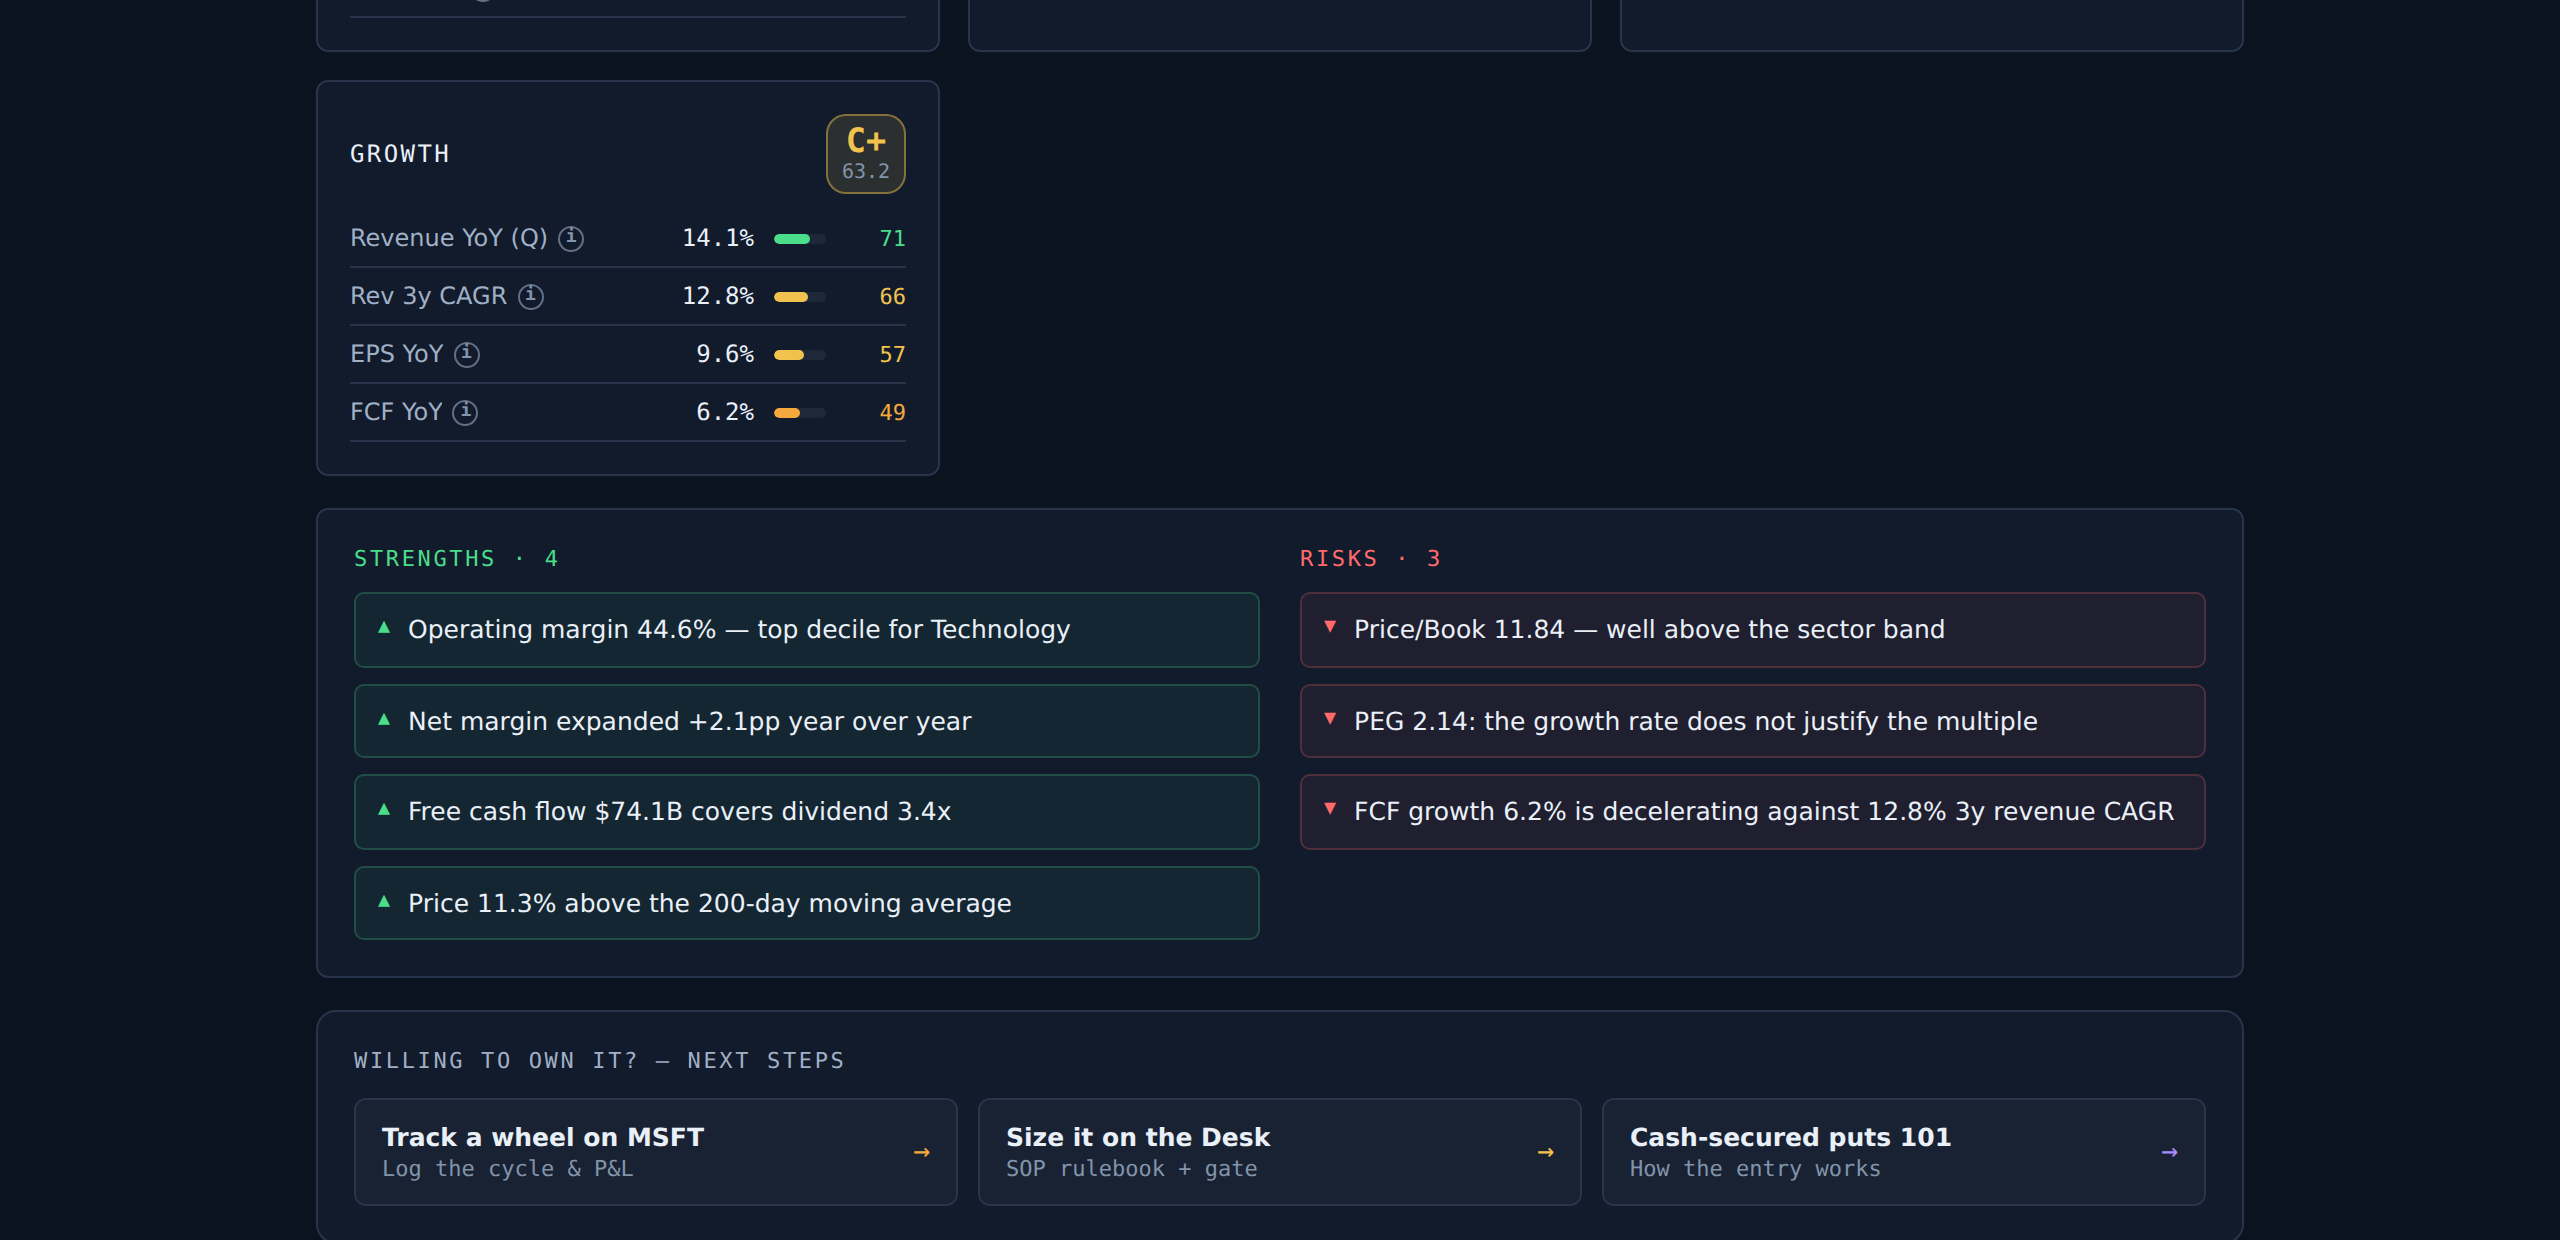
Alongside the scores, the grader surfaces directional flags computed from the same data — margin expansion or compression, cash flow covering the dividend, a multiple that has outrun growth. These are the specific sentences you would want a colleague to say to you before you committed capital.
What a fundamentals grade cannot tell you
Being clear about the limits is what makes the grade usable:
- The earnings calendar. A great company reporting in nine days is a different proposition from the same company reporting in nine weeks.
- Liquidity and spread. A wide bid-ask can consume more edge than a mediocre grade ever will.
- Implied volatility. The grade says whether you want to own it. It says nothing about whether options on it are richly priced today.
- Balance-sheet detail. Debt maturity walls and covenant risk need the filings.
- Position sizing. No grade tells you how much. That belongs in your Portfolio Rules.
A fundamentals grade answers exactly one question — is this worth owning? — and answers it consistently. The next question, where do I put the entry and the stop, is a volatility question, answered by the realized volatility profile for the same instrument. And whether your judgement on either is any good is what the Trade Journal is for.
Grade a ticker in ten seconds
Enter a symbol, get a report card. No signup, no watchlist to build, no portfolio to connect. Data comes from Yahoo Finance, so price-based metrics reflect the latest quote and statement metrics update with each quarterly filing.
Grade a stock now and find out whether the name you were about to buy is one you would actually want to own.
Frequently asked questions
What should a stock fundamentals checklist include?
Four categories: valuation (P/E, price/book, price/sales, EV/EBITDA, PEG, free cash flow yield), profitability (gross, operating, net and FCF margin, plus ROE and ROA), growth (revenue and EPS year-over-year and three-year revenue CAGR), and momentum (price versus the 200-day moving average, trailing returns, and position in the 52-week range).
How do you tell if a stock is fundamentally strong?
A fundamentally strong company generates consistent free cash flow, holds or expands its margins, grows revenue and earnings, and trades at a multiple its growth rate can justify. No single metric decides it — strength is agreement across valuation, profitability and growth at the same time.
Why are fundamental metrics adjusted by sector?
Because normal ranges differ enormously by industry. A 12x price/earnings ratio is expensive for a regional bank and cheap for a software company, and price/book is meaningful for a bank and nearly meaningless for an asset-light business. Sector adjustment scores each metric against its sector peers, so the grade reflects relative quality instead of industry averages.
What is free cash flow yield and why does it matter?
Free cash flow yield is free cash flow divided by market capitalisation. It shows how much real cash the business generates per dollar of price. It matters because cash generation, not accounting earnings, determines whether a company can fund itself, pay a dividend or survive a downturn without raising capital.
What is a good fundamentals score for a stock?
As a working rule, a score of 70 or above suggests a business you can hold through a drawdown, 50 to 70 warrants smaller size or more scrutiny, and below 50 means the market is likely pricing genuine deterioration rather than a temporary discount.
Is a stock trading below its 200-day moving average a red flag?
It is a caution flag rather than a disqualifier. Price below the 200-day average signals a downtrend, which means the market currently disagrees with a bullish fundamental case. Strong fundamentals plus weak momentum can be an entry for a patient buyer; weak plus weak usually is not.
What is the difference between a fundamentals grade and an analyst rating?
A fundamentals grade is a rules-based score computed from reported financial data. An analyst rating is a forward-looking human opinion that includes price targets and forecasts. The grade is reproducible and applies the same yardstick to every company; the rating does neither.
Does fundamental analysis matter for short-term trades?
It matters for anything you might end up holding. A short holding period reduces time exposure, not downside exposure, and a fundamentally weak company can fall further in one session than a short-term thesis allows for. It matters less for trades exited intraday on a technical signal.
What does a fundamentals grade not tell you?
It does not cover the earnings calendar, liquidity or bid-ask spread, implied volatility, detailed balance-sheet risks such as debt maturities and covenants, or position sizing. It answers whether the business is sound relative to its peers, which is one input among several.
Where does the fundamentals data come from?
ThetaHarvester's grader pulls from Yahoo Finance, so price-based metrics reflect the latest quote and financial-statement metrics update with each quarterly filing.