Trading Journal: Prove Your Edge in R, Not Dollars
Short answer: A trading journal should record the plan before the trade as a separate record from the outcome, then report expectancy in R-multiples with the sample size and a 95% confidence interval attached. R normalises results across stocks, ETFs, options, futures, FX and crypto, so one number describes a whole book.
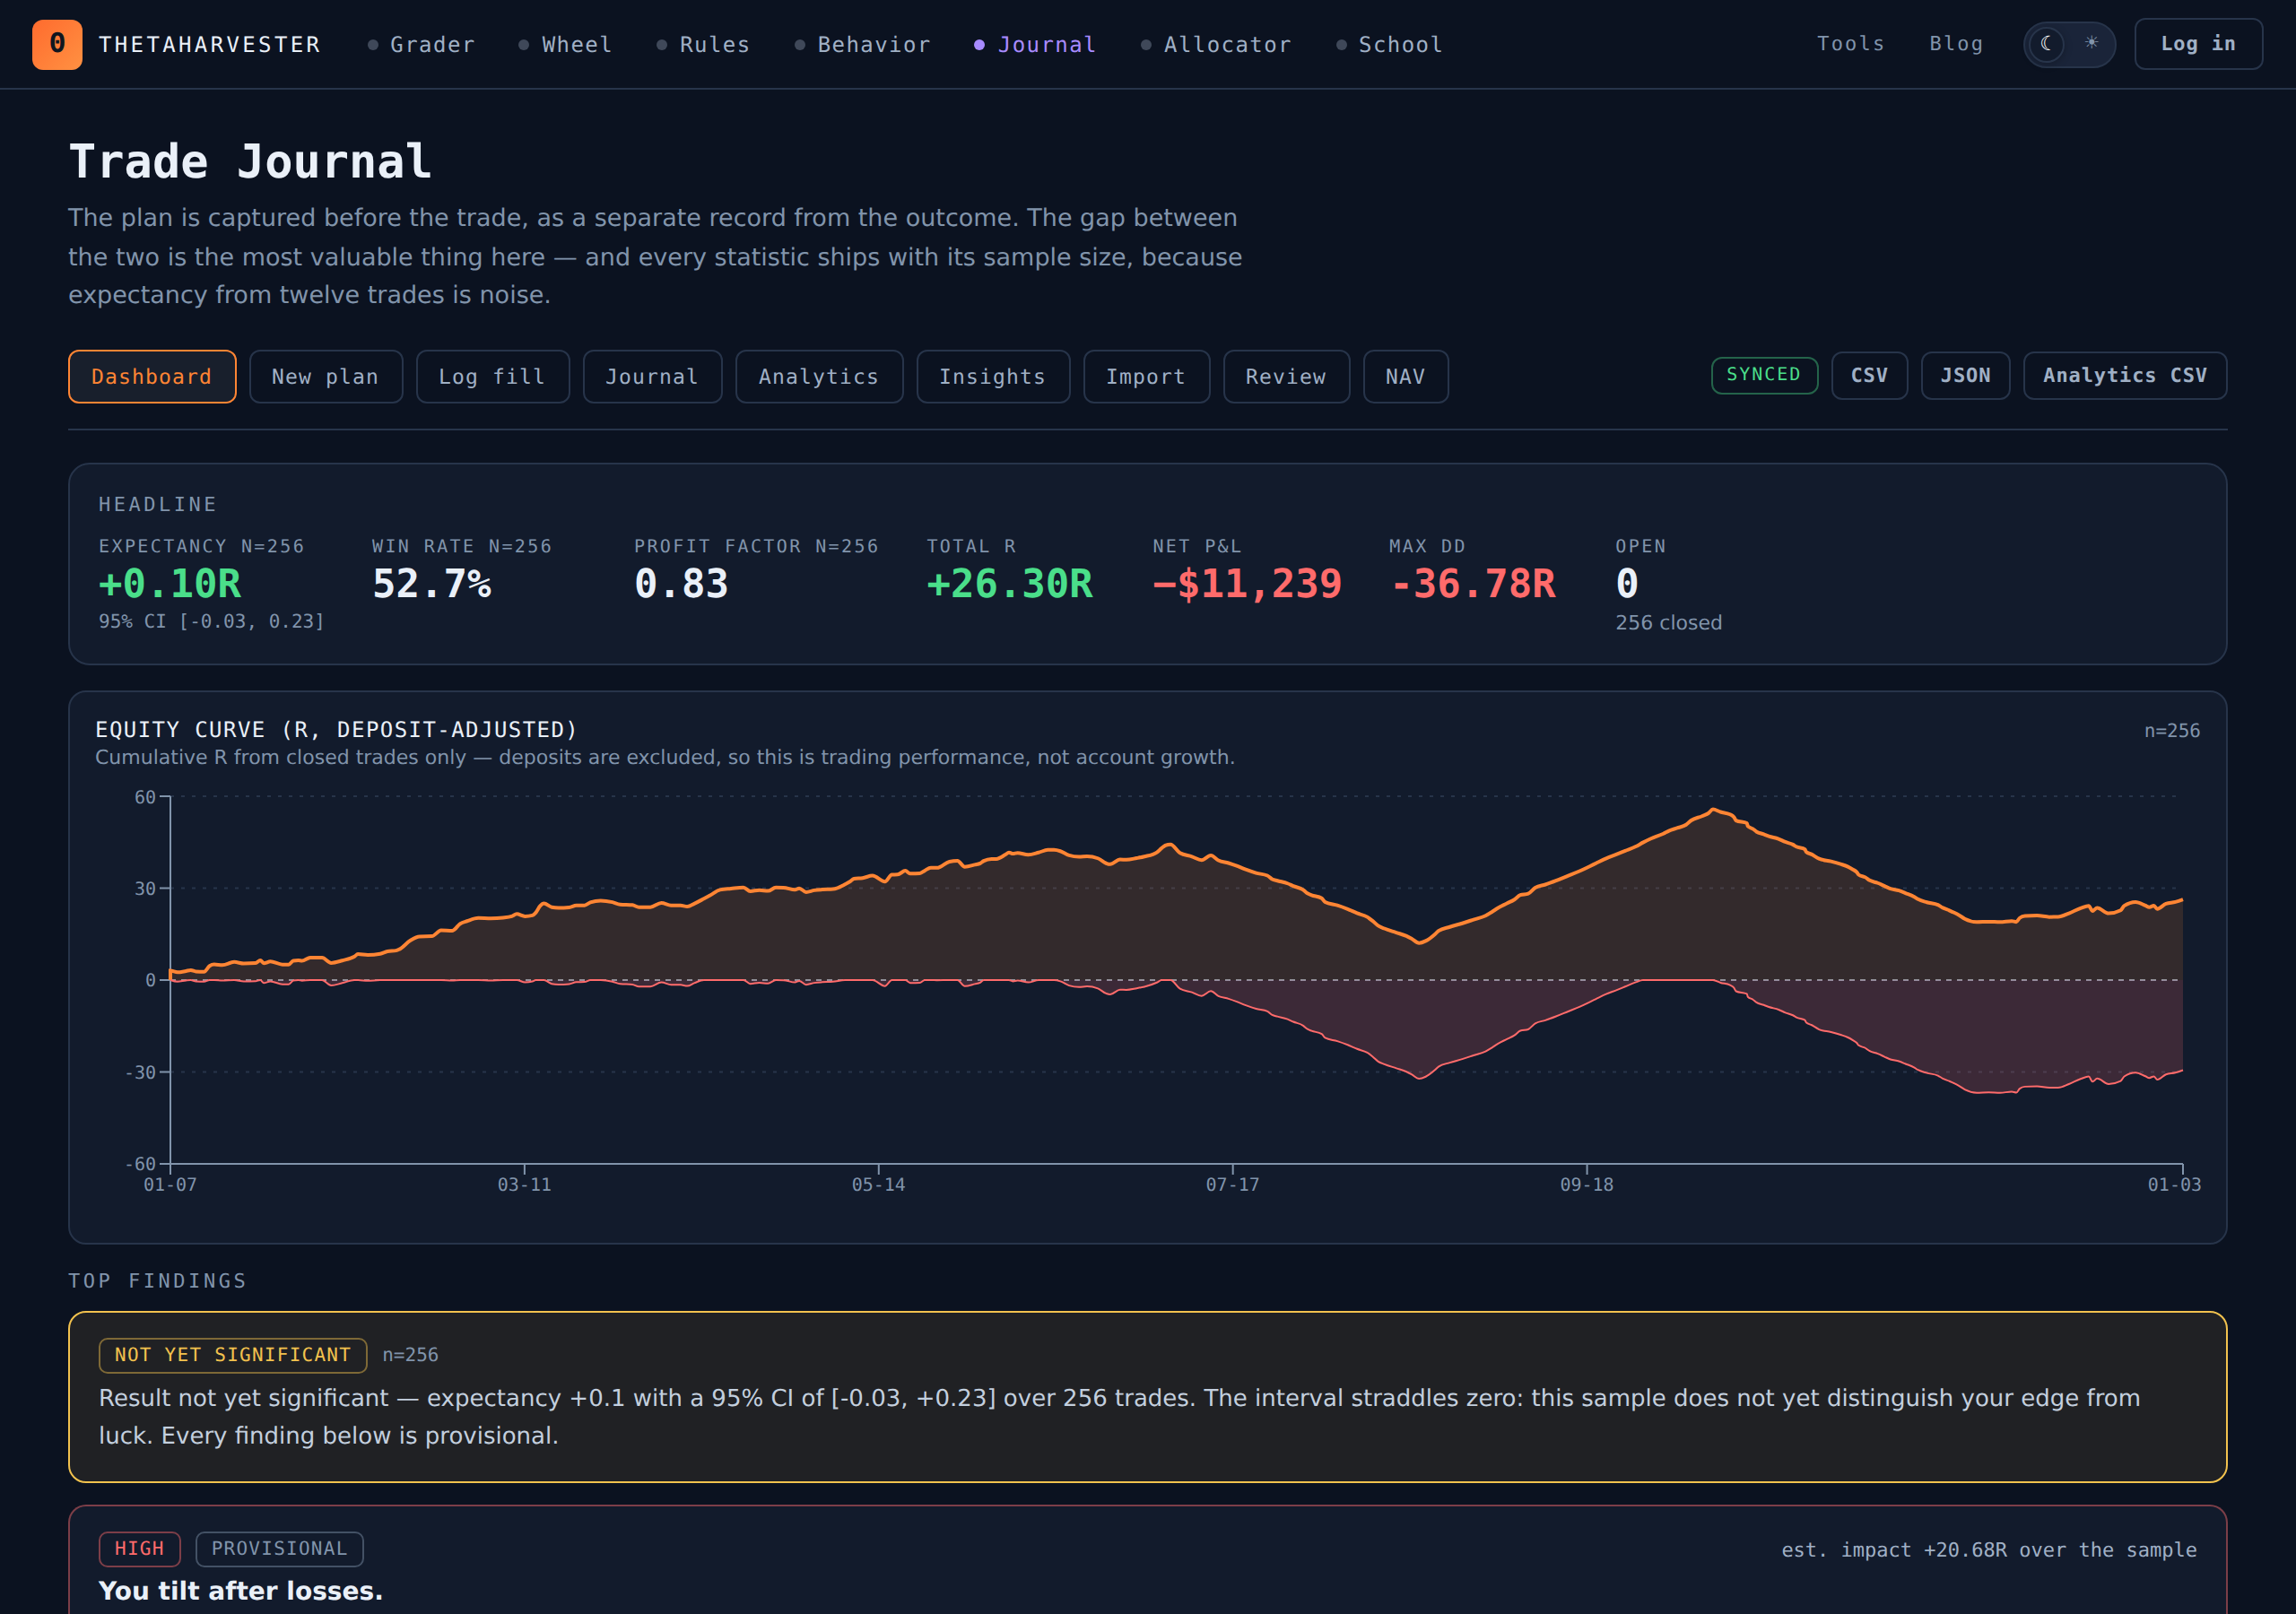
You are up 8% this year. Is that skill, or is that sixty trades of variance?
Most trading journals cannot answer that question, because most trading journals are profit-and-loss logs with a notes field. They record what happened. They do not tell you whether it will happen again.
The Trade Journal in ThetaHarvester is built around a different question: does this operator have a measurable edge, and where is it leaking?
One journal for the whole book
The journal is instrument-agnostic. Every trade carries an instrument class — equity, ETF, option, future, FX or crypto — a currency, and a contract multiplier.
That multiplier is what makes a single journal honest across asset classes. It converts price movement into money: 100 for an equity option, the point value for a futures contract, the lot size for an FX pair, 1 for shares and most crypto. Get it right per trade and a 2-lot in the E-mini, three call contracts and 220 shares of an ETF all resolve to comparable dollar risk.
Which sets up the thing that actually makes a mixed book measurable.
R-multiples, not dollars
An R-multiple expresses a trade's result as a multiple of what you risked. Risk $500, make $1,500, and the trade is +3R. Lose the full stop distance and it is −1R.
For a single-asset trader, R mainly corrects for position size. For anyone running more than one asset class, it does something more important: it makes the book summable.
Consider four trades from the same account:
| Instrument | Class | Position | Risk | Result | In R |
|---|---|---|---|---|---|
| GDX | ETF | 220 shares @ $44.20 | $462 | +$693 | +1.5R |
| AAPL | Option | 3 contracts @ $2.40 | $360 | −$360 | −1.0R |
| ES | Future | 1 contract @ 5204 | $500 | +$1,000 | +2.0R |
| BTCUSD | Crypto | 0.22 @ $64,200 | $440 | +$220 | +0.5R |
In dollars those four results — $693, −$360, $1,000, $220 — say almost nothing, because the position sizes and contract specs are incomparable. In R they average to +0.75R, which is a statement about the process rather than about how big the positions happened to be.
Percent-of-NAV gets the same care. Every %NAV figure resolves against the NAV as of the trade's entry date, read from a NAV time series rather than a single current figure. If you fund the account monthly, one current NAV would silently corrupt every historical percentage in the journal.
Log the plan before the trade, as its own record
The journal keeps two separate tables. A plan is written before the order goes in; a trade records the fills and the exit. Every trade either links to a plan or is explicitly flagged unplanned.
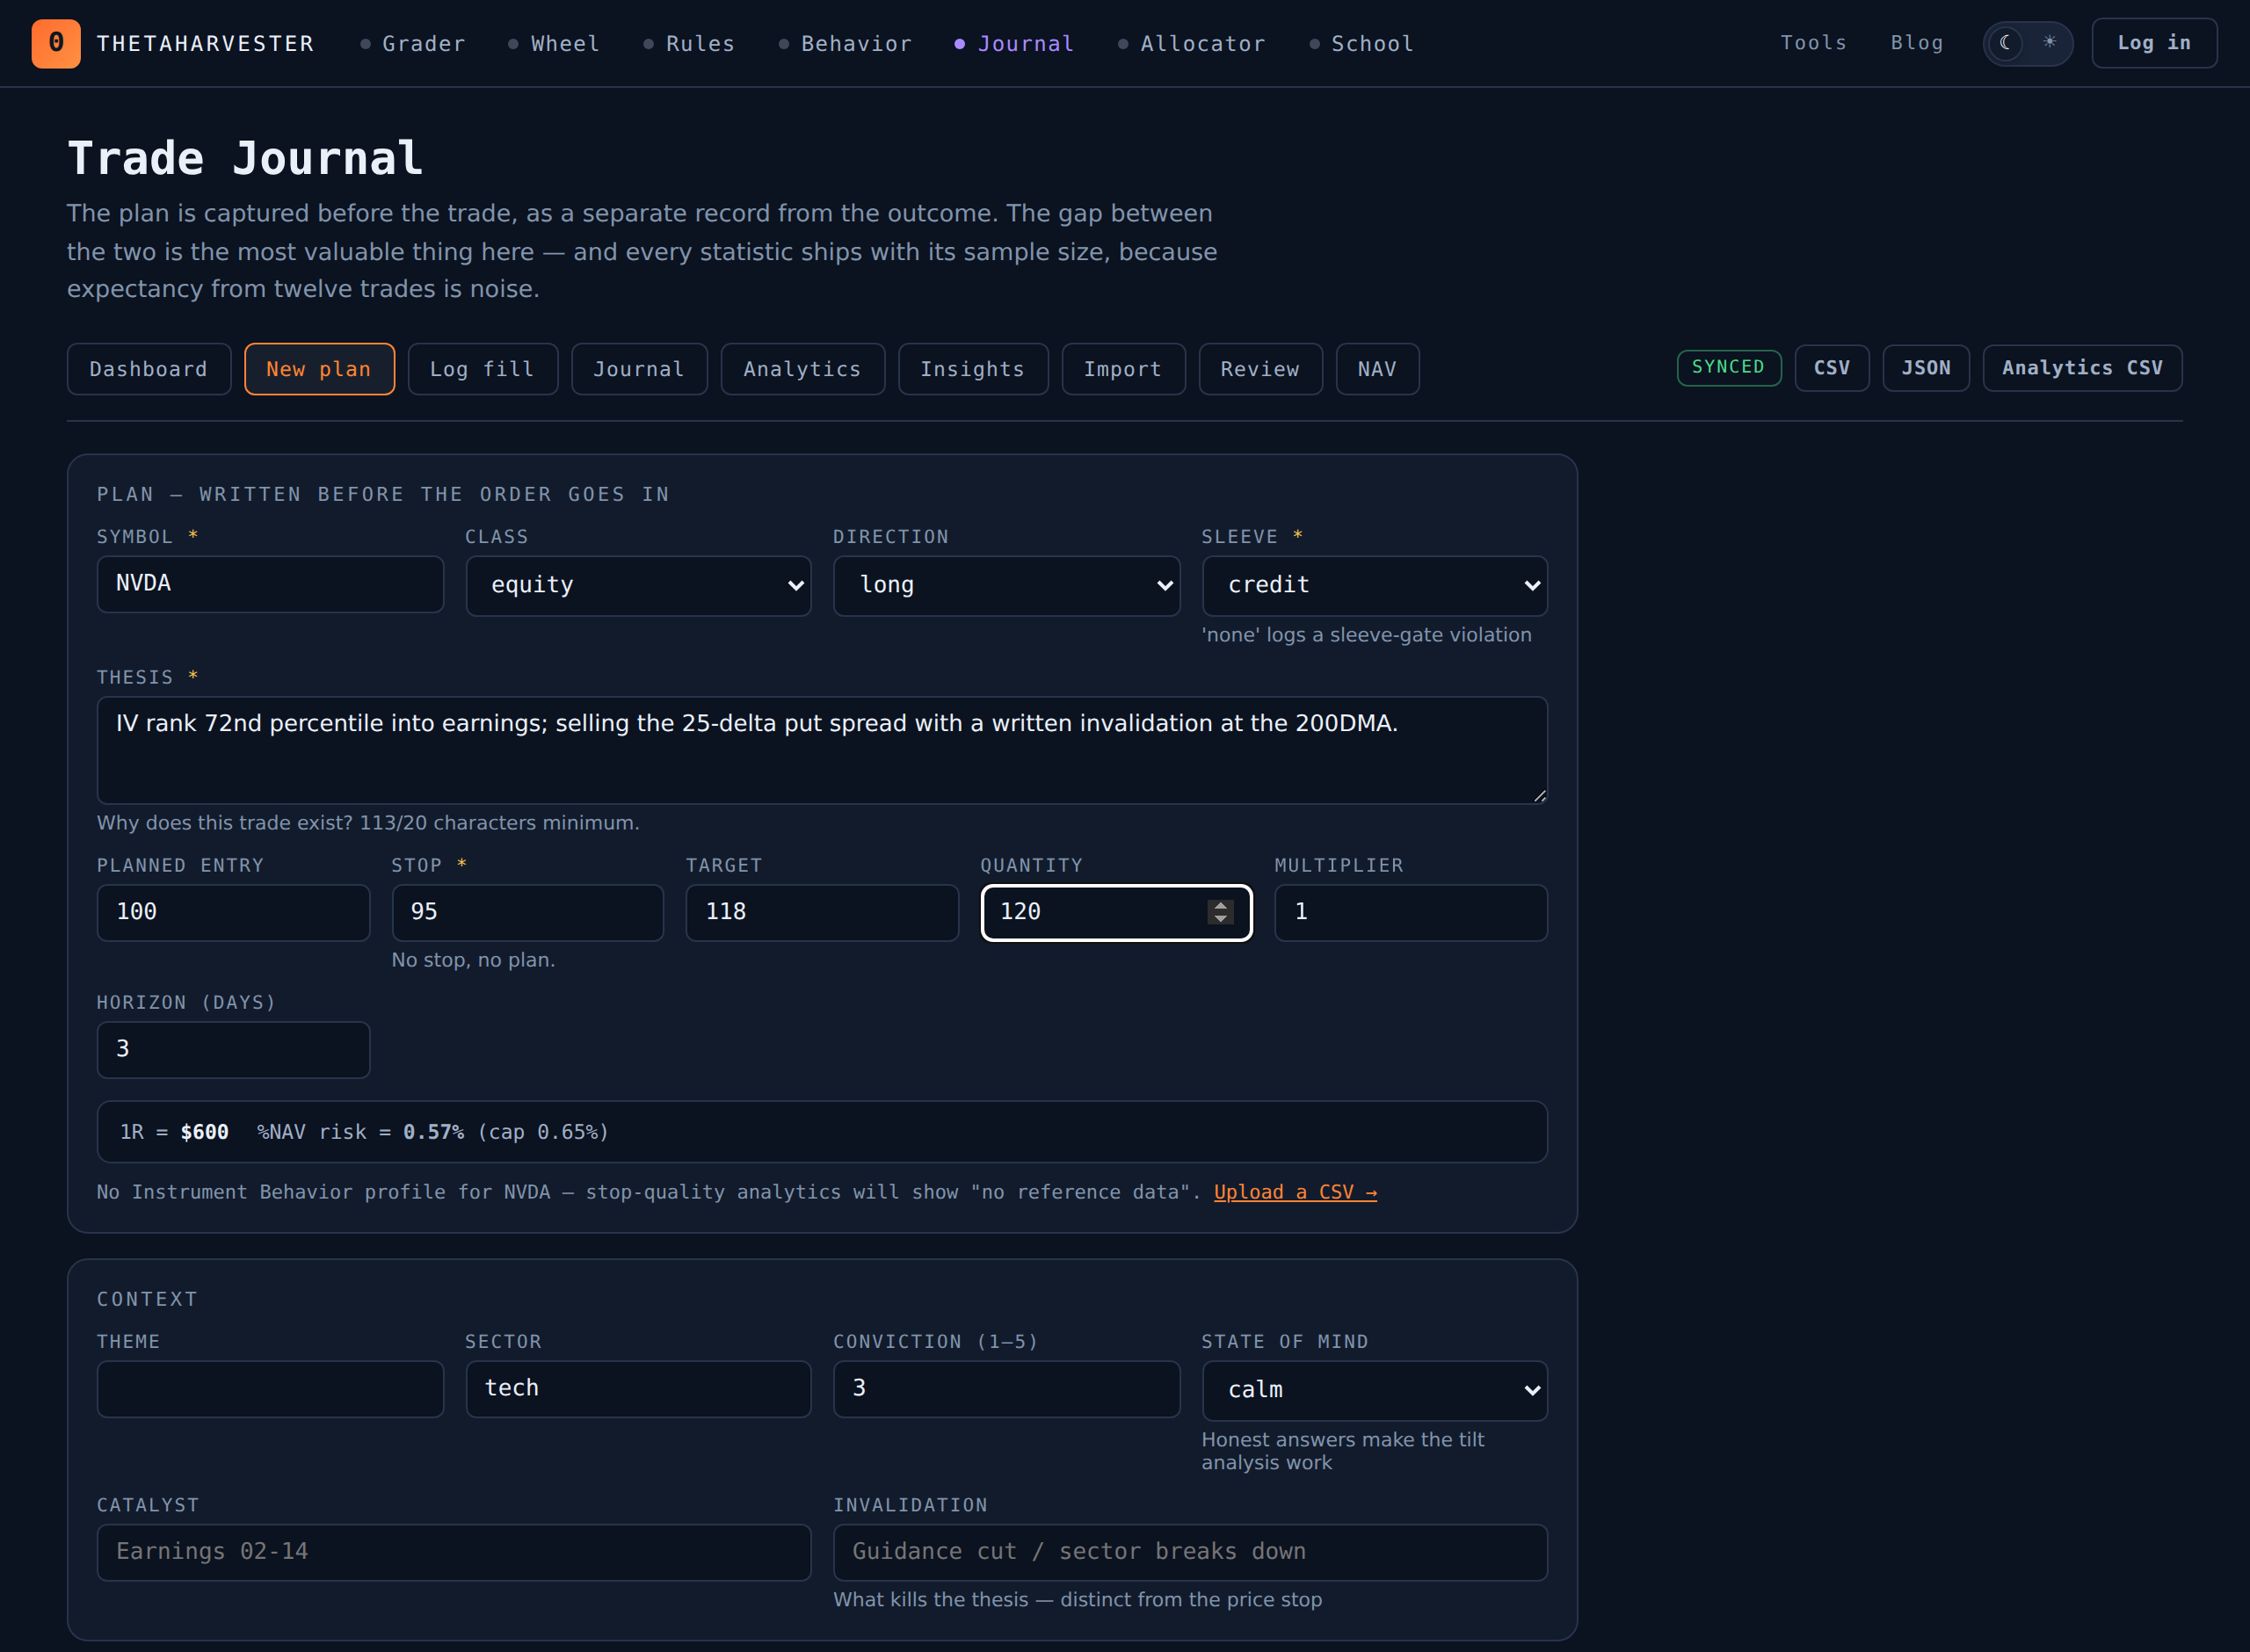
The plan form refuses to save without three things: a sleeve, a stop, and a thesis of at least twenty characters. That refusal is deliberate. A plan you can save without a stop is not a plan, and a thesis you can leave blank measures nothing.
Nothing back-fills a plan onto a trade after the outcome is known. That would destroy the adherence metric, which is the whole point of keeping the two records apart.
Because the plan exists as data, three things become measurable that a notes field can never capture:
- Planned vs unplanned expectancy, compared side by side
- Override rate — how often you executed something other than what you wrote
- Checklist completion, and whether fully-completed trades outperform partial ones
Every statistic ships with its sample size
This is what separates the journal from every dashboard that shows you a confident number.
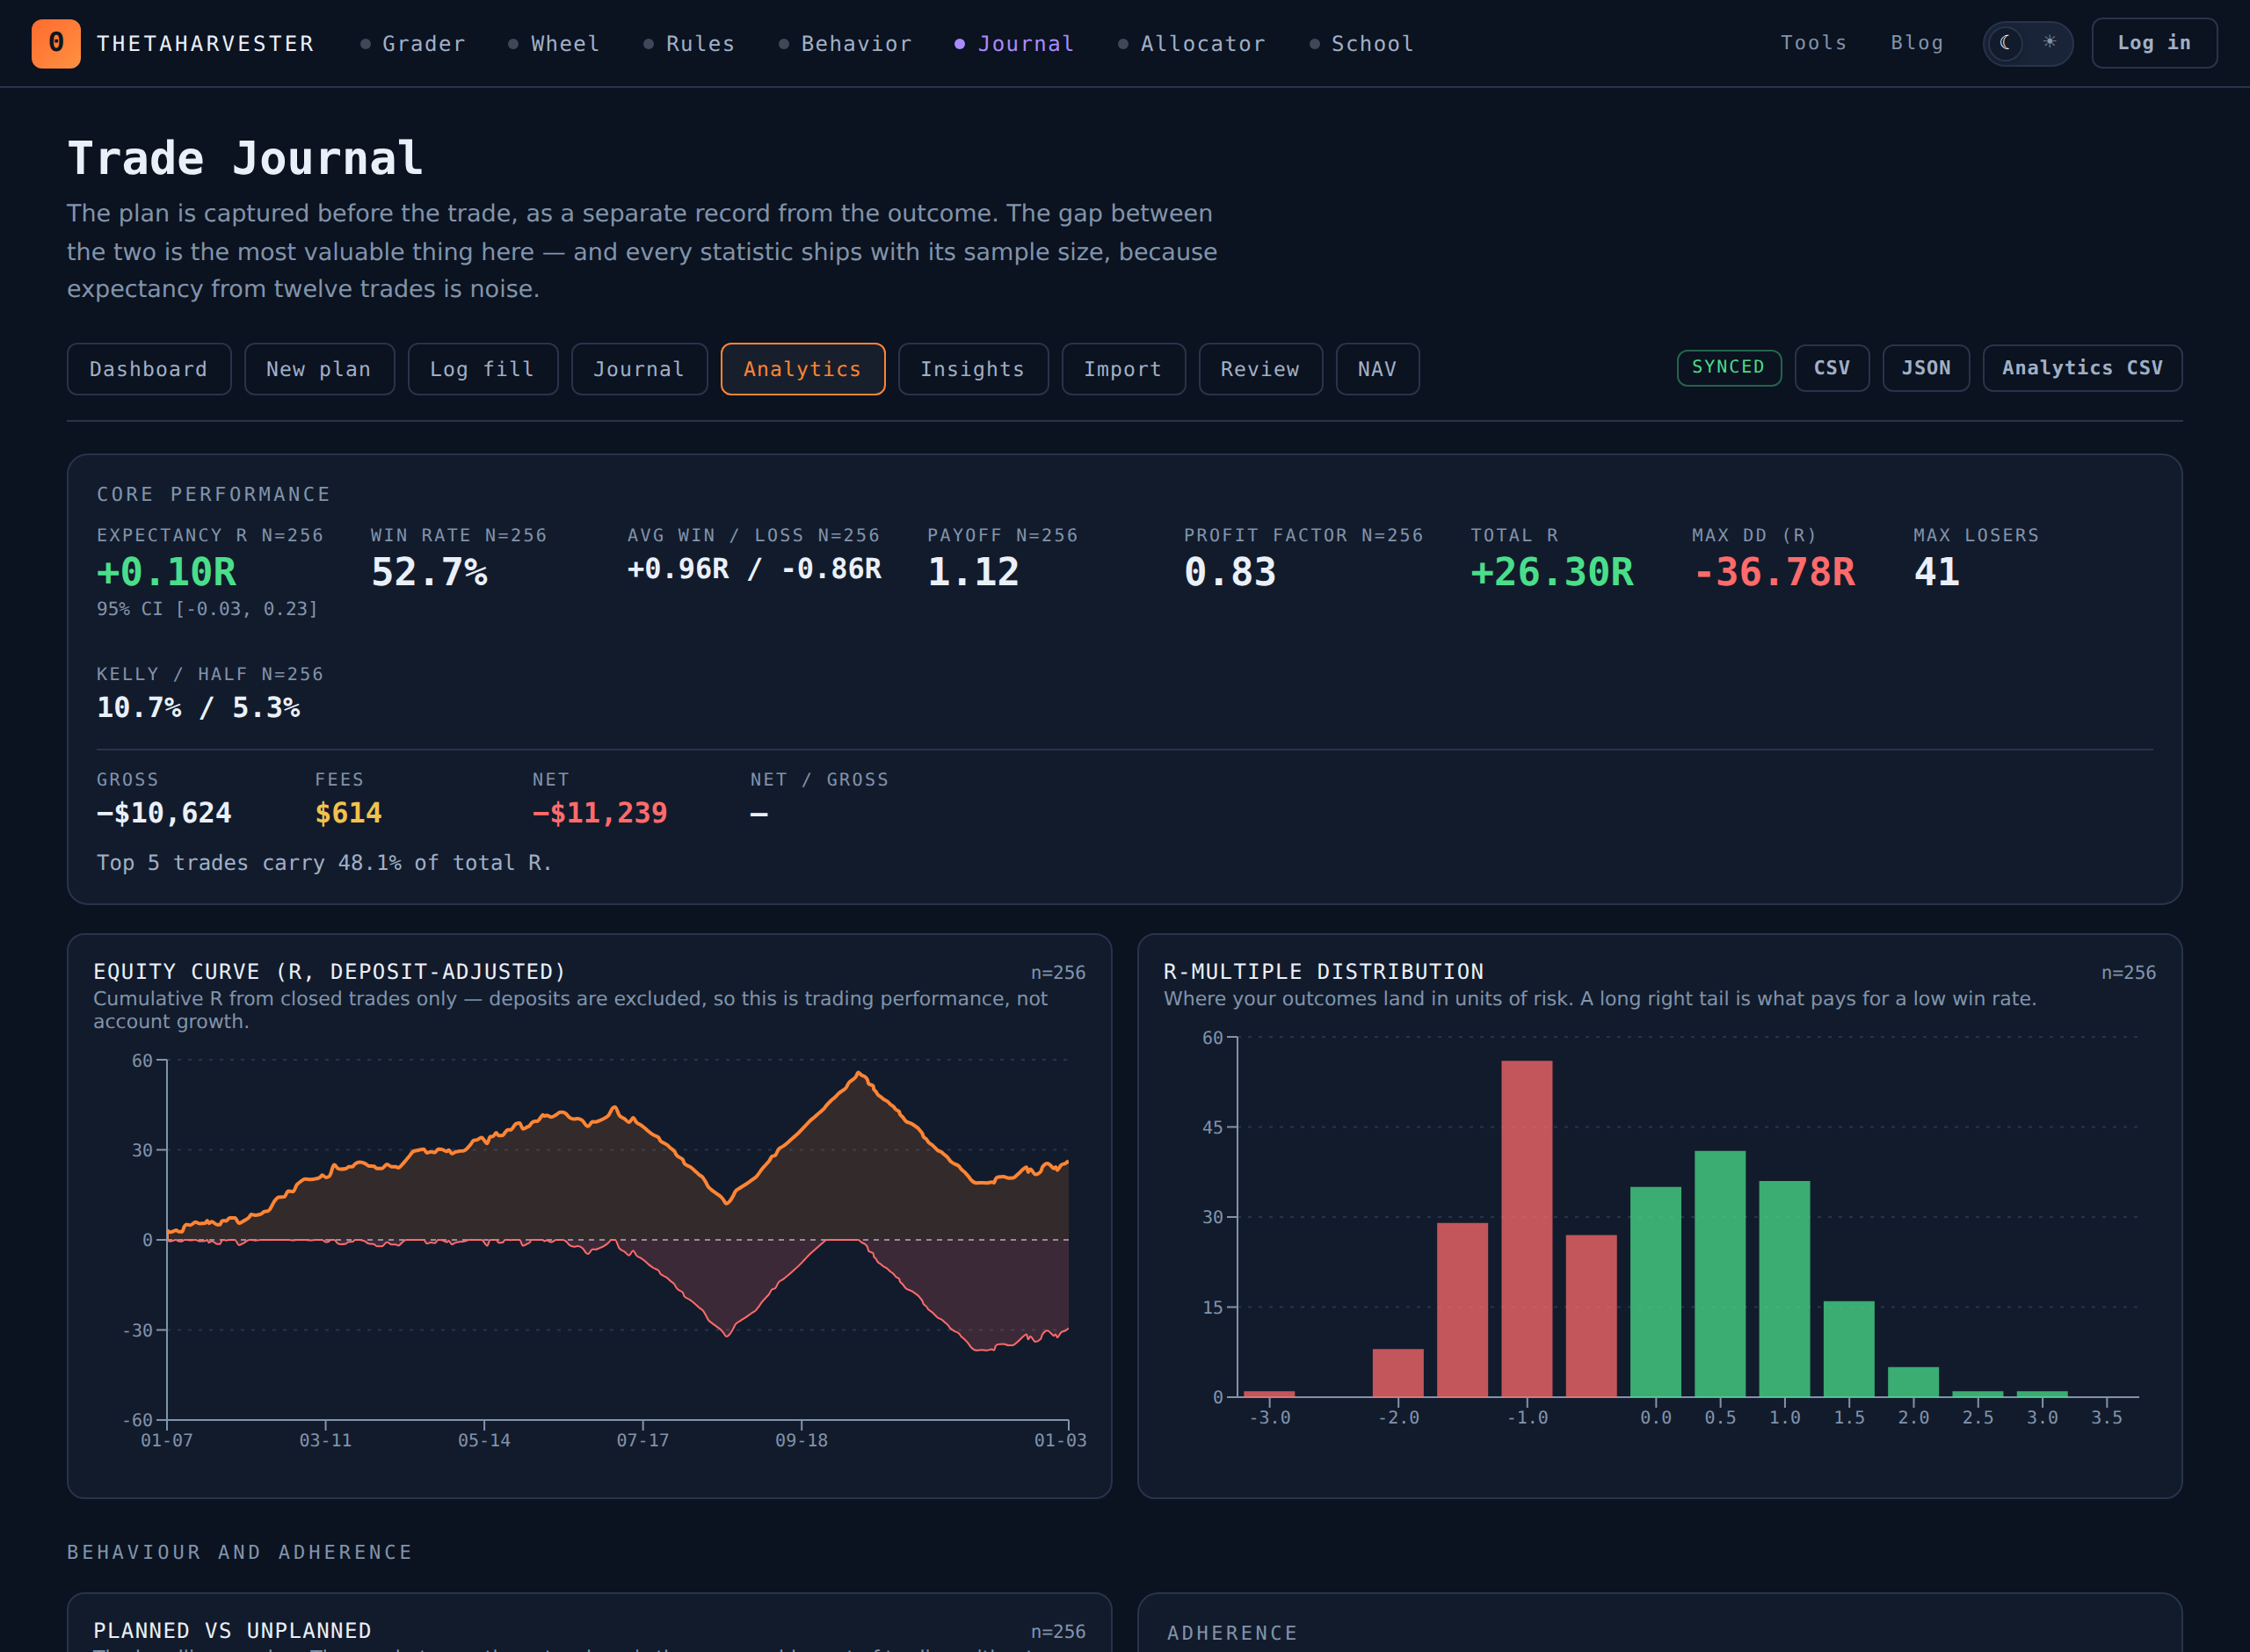
Expectancy is reported with a 95% confidence interval computed from the t-distribution. Every bucketed statistic — by instrument class, sleeve, sector, theme, holding period, conviction, day of week — carries its own n and its own interval. Anything below n=30 renders greyed with the label "insufficient sample — not a conclusion".
That gate is a hard rule, not a display preference. Expectancy from twelve trades is noise, and a journal that presents noise as insight is worse than no journal at all.
The consequence is a headline you will not see elsewhere: when the confidence interval on your expectancy spans zero, the journal says so at the top of the insights panel and marks every other finding provisional. It will tell you your sample does not yet distinguish your edge from luck — even when the point estimate is positive.
This matters more for a multi-asset book than a single-strategy one, because slicing a mixed sample by instrument class is exactly how you end up with six buckets of twenty trades each and six confident-looking numbers, none of which mean anything.
The behavioural analytics that find the leak
Strategy problems are the ones traders look for. Behavioural leaks are the ones that cost the money, and they only show up when the data is sliced by how you traded rather than what you traded.
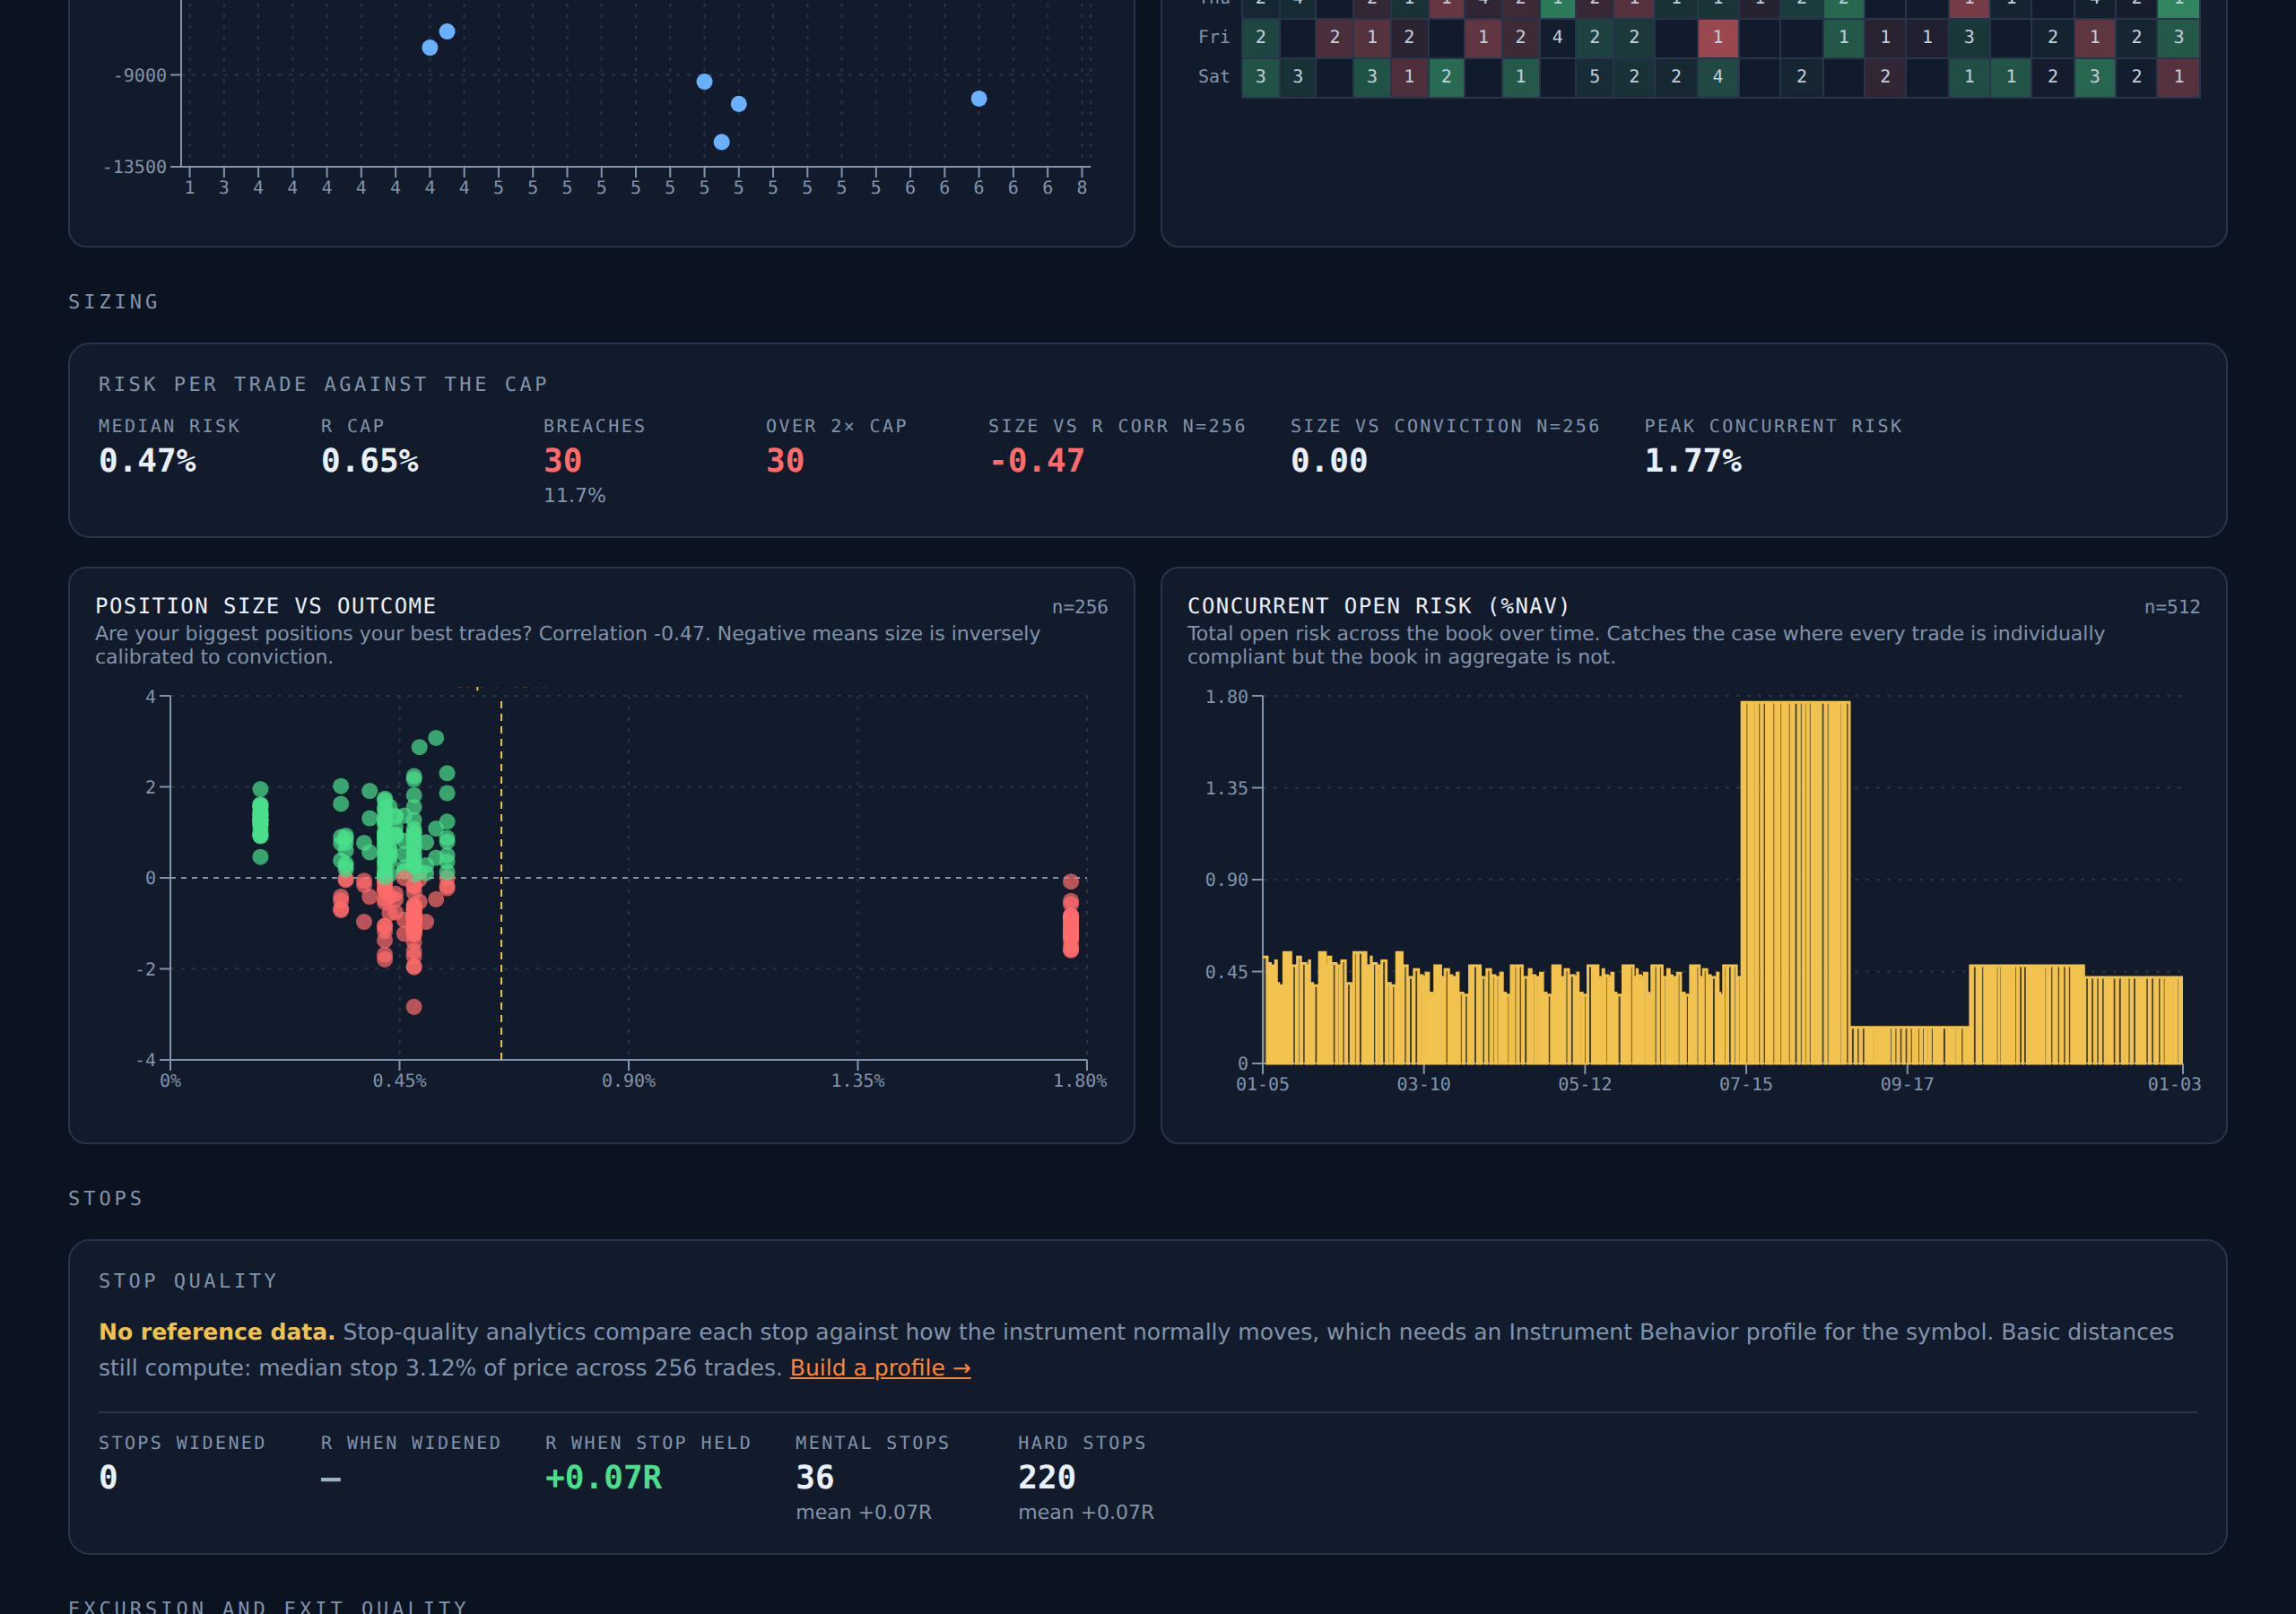
- Size vs outcome correlation — are your largest positions your best trades, or your worst? A negative correlation is a conviction-calibration failure and gets named as one.
- Tilt detection — expectancy on trades entered within sixty minutes of a loss, after a three-loss streak, and after a large win, each against your baseline.
- Overtrading — trades per week plotted against weekly net P&L, with commissions as a second series.
- Stop-distance analysis — how many of your stop-outs had a stop sitting inside the instrument's ordinary noise.
- MAE/MFE and exit efficiency — how much of the available move you actually captured.
- Stop-movement audit — every stop moved away from entry, counted, with the P&L of those trades against the ones where the stop held.
That last one is usually the most expensive single line item in a discretionary journal, and almost nothing else records it.
Concurrent open risk is charted as a time series with your deployment band overlaid, which catches the case where every trade is individually inside the cap but the book in aggregate is not — a failure mode that gets considerably easier to hit once you are trading several instrument classes at once.
The metrics that survive scrutiny
Core performance reports expectancy in R and dollars, win rate, average win and loss in R, payoff ratio, profit factor, Kelly and half-Kelly as context rather than instruction, max drawdown in R, longest flat period, and maximum consecutive losers.
Two deserve specific mention:
The equity curve is deposit-adjusted. It plots cumulative R from closed trades only, so regular contributions cannot masquerade as trading performance. An account that grew because you funded it looks flat here, which is correct.
Fee drag is surfaced as net over gross. A high-frequency stretch that grosses a few hundred dollars and nets forty is a commission problem, not a strategy problem, and the journal names it when the ratio falls below 0.75.
There is also a contribution concentration view: what fraction of total R came from your top five trades. If a handful carry the entire result, the apparent edge is one outlier away from vanishing, and that deserves stating rather than burying.
The insights engine names the leak
The insights panel is deterministic and rules-driven. No language model, no interpretation — each finding is a template filled with your numbers and its sample size, ranked by estimated R impact.
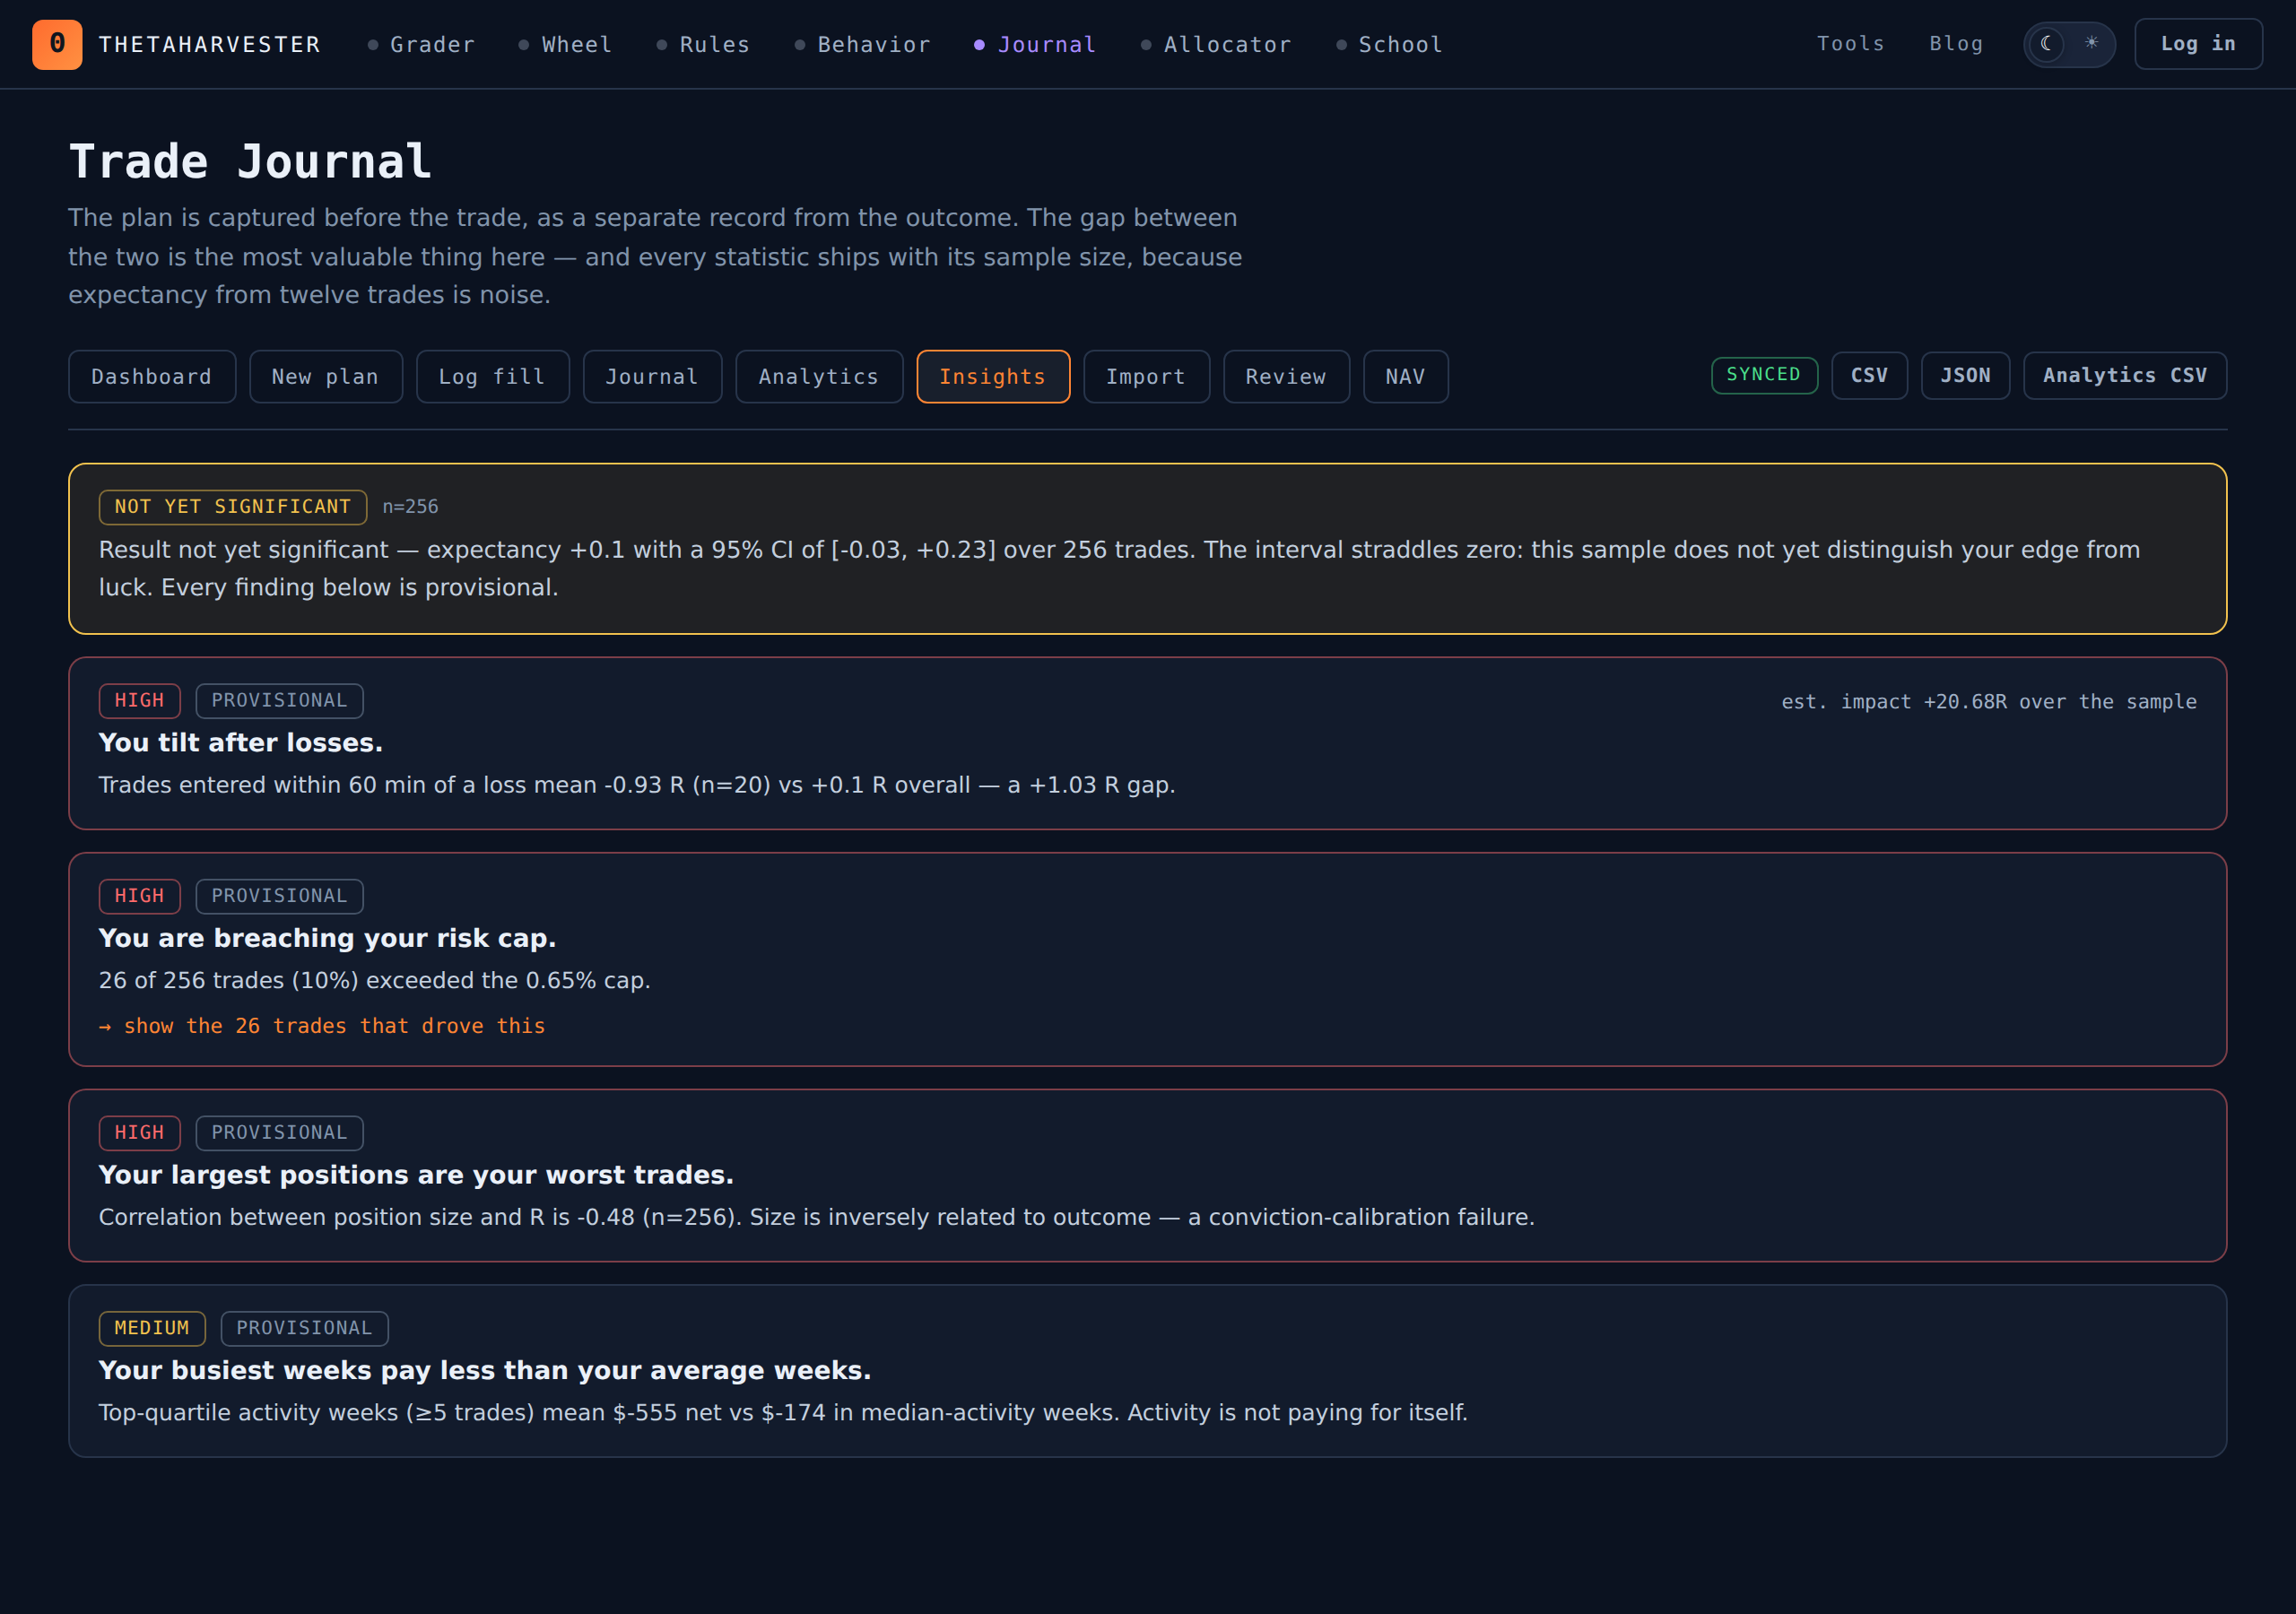
A finding reads: "Trades entered within 60 min of a loss mean −0.92R (n=20) vs −0.04R overall — a 0.89R gap." Statement, numbers, sample size, and a clickable list of the trades that drove it.
Two rules are deliberately stricter than the obvious version. "Your busiest weeks pay less than your average weeks" is a coin flip on random data and would fire about half the time on a journal with no effect at all, so it requires at least six weeks per cohort and a material margin. Concentration requires a meaningfully positive total R, because a share-of-total is meaningless when the total is near zero.
The significance row is mandatory and cannot be suppressed. If the sample does not support a claim of edge, that is the first thing you read.
Where the edge actually lives
Bucketed expectancy breaks the sample down by instrument class, sleeve, sector, theme, direction, holding-period bucket and conviction level — each with n, a 95% interval, win rate, profit factor and total R contribution.
Buckets rank by total R contribution, not win rate. A bucket that wins 90% of the time while contributing −4R is a losing bucket, and sorting by win rate would hide that.
This is the view that answers the question a multi-asset trader actually has: which of these am I any good at? Very often the answer is that one class carries the book and another has been quietly funding it — and until the sample in each is large enough, the journal will keep telling you that too.
If you trade options as well
Options carry an extra detail record, so the journal also reports premium capture rate, outcome by DTE, delta and IV-rank bucket at entry, assignment rate and post-assignment outcome, adherence to a 21-DTE management rule, and roll chains evaluated as a single lifecycle. That last one matters: a repeatedly-rolled loser shows up as a string of small wins and one large loss, and only the chain view prevents that illusion.
These sit alongside the general analytics rather than replacing them. An options trade is still a trade with a stop, an R-multiple and a plan.
The plan and the journal are two different documents
Your Portfolio Rules state what you intend to do, in advance, in dollars pegged to your live NAV. The journal tests whether that intent had an edge.
You need both, and they should stay separate records. The rulebook is the hypothesis. The journal is the experiment.
Start with the next trade
The analytics are worthless without data, and data starts accumulating from the first plan you write — so the useful move is not importing three years of history, it is writing one plan before your next trade.
Open the Trade Journal and log the plan first. In thirty trades you will have something to look at. In a hundred, something to act on.
Frequently asked questions
What is an R-multiple in trading?
An R-multiple expresses a trade's result as a multiple of the amount you risked on it. If you risked $200 and made $600, that trade is +3R; if you lost the full amount risked, it is −1R. Using R instead of dollars makes trades comparable across different position sizes, instruments and account sizes.
What is trading expectancy and how is it calculated?
Expectancy is the average R-multiple per trade — the sum of all trade results in R divided by the number of trades. An expectancy of +0.2R means each trade returns, on average, 0.2 times the amount risked. Positive expectancy over a large enough sample is what having an edge means.
Can one trading journal handle stocks, options, futures and crypto together?
Yes, provided it stores a contract multiplier per trade and reports results in R rather than dollars. The multiplier converts price movement into currency — 100 for an equity option, the point value for a futures contract, 1 for shares — and R then normalises the outcomes so a futures trade and a stock trade can be compared directly.
How many trades do you need before your trading statistics mean anything?
Roughly 30 trades is the minimum before a statistic is worth looking at, and 100 or more before it is worth acting on. Below 30, the confidence interval around a win rate or expectancy is usually wide enough to include both a profitable strategy and a losing one.
Why is win rate a misleading trading metric?
Win rate says nothing about the size of wins relative to losses. A strategy that wins 80% of the time but loses 5R on its losers is unprofitable, while a 35% win rate with 3R winners is strongly profitable. Expectancy and profit factor capture both halves; win rate captures one.
What are MAE and MFE in a trading journal?
MAE (maximum adverse excursion) is the furthest a trade moved against you before it closed. MFE (maximum favourable excursion) is the furthest it moved in your favour. Comparing your actual exit against the MFE gives exit efficiency — how much of the available move you captured.
What is exit efficiency?
Exit efficiency measures your realised result as a proportion of the best result the trade offered, calculated as the captured move divided by the maximum favourable excursion. Consistently low exit efficiency on winners suggests you are exiting too early.
What is tilt detection in a trading journal?
Tilt detection compares your performance on trades placed shortly after a loss against your baseline expectancy. If expectancy drops materially in the trades following a loss, that is a measurable behavioural leak rather than a strategy problem, and it is fixable with a cooling-off rule.
Why should a trading journal show confidence intervals?
Because a single number like expectancy +0.4R implies a precision the data may not support. A 95% confidence interval shows the range the true value plausibly sits in. If that interval spans zero, the data does not yet demonstrate an edge, regardless of what the point estimate says.
What is a deposit-adjusted equity curve?
A deposit-adjusted equity curve removes the effect of deposits and withdrawals so the line reflects trading performance only. Without the adjustment, adding cash to an account looks identical to making money.
Should I journal my trading plan separately from the outcome?
Yes. Recording the plan as its own record, written before entry, is the only way to later measure how often you deviated from it and whether your planned trades outperformed your improvised ones. A plan written after the outcome is known is a rationalisation, not a plan.