What a Stock Price Actually Tells You — Price Is a Forecast
Short answer: A stock price is not a rating of how good the company is. It is the market's forecast of all the cash the business will ever produce, converted into one number today. Fundamental analysis is the search for prices whose forecast is wrong — too optimistic or too pessimistic — which is why a great company can be a bad investment and a struggling one can be a great one.
A share price is not a score out of ten. It is a forecast — the market's estimate of all the cash a business will ever produce for its owners, squeezed into a single number today. Fundamental analysis is the craft of deciding whether that forecast is wrong, and in which direction.
That one idea changes what you are looking for. Not good companies. Wrong prices.
What a stock price actually tells you
When you buy a share, you buy a small slice of a company: a claim on the cash the business will produce in the future, some paid to you as dividends, some kept and reinvested to make the business bigger.
By the time you look at the price, thousands of people have already studied the company, formed an opinion, and bought or sold. The price is where their opinions balanced out. So the price already contains an assumption about the future — and that has an uncomfortable consequence. A very good company can be a bad investment, because the price already assumes it will be very good. A struggling company can be a good investment, because the price already assumes it will struggle — and struggling slightly less than expected is enough to send the shares up.
The question is never "is this a good company?" The question is: what does today's price assume about the future, and is that assumption too optimistic or too pessimistic? Everything in The Ledger, ThetaHarvester's free fundamental analysis course, is a tool for answering that one question.
The Intel lesson: "cheap" is a prediction
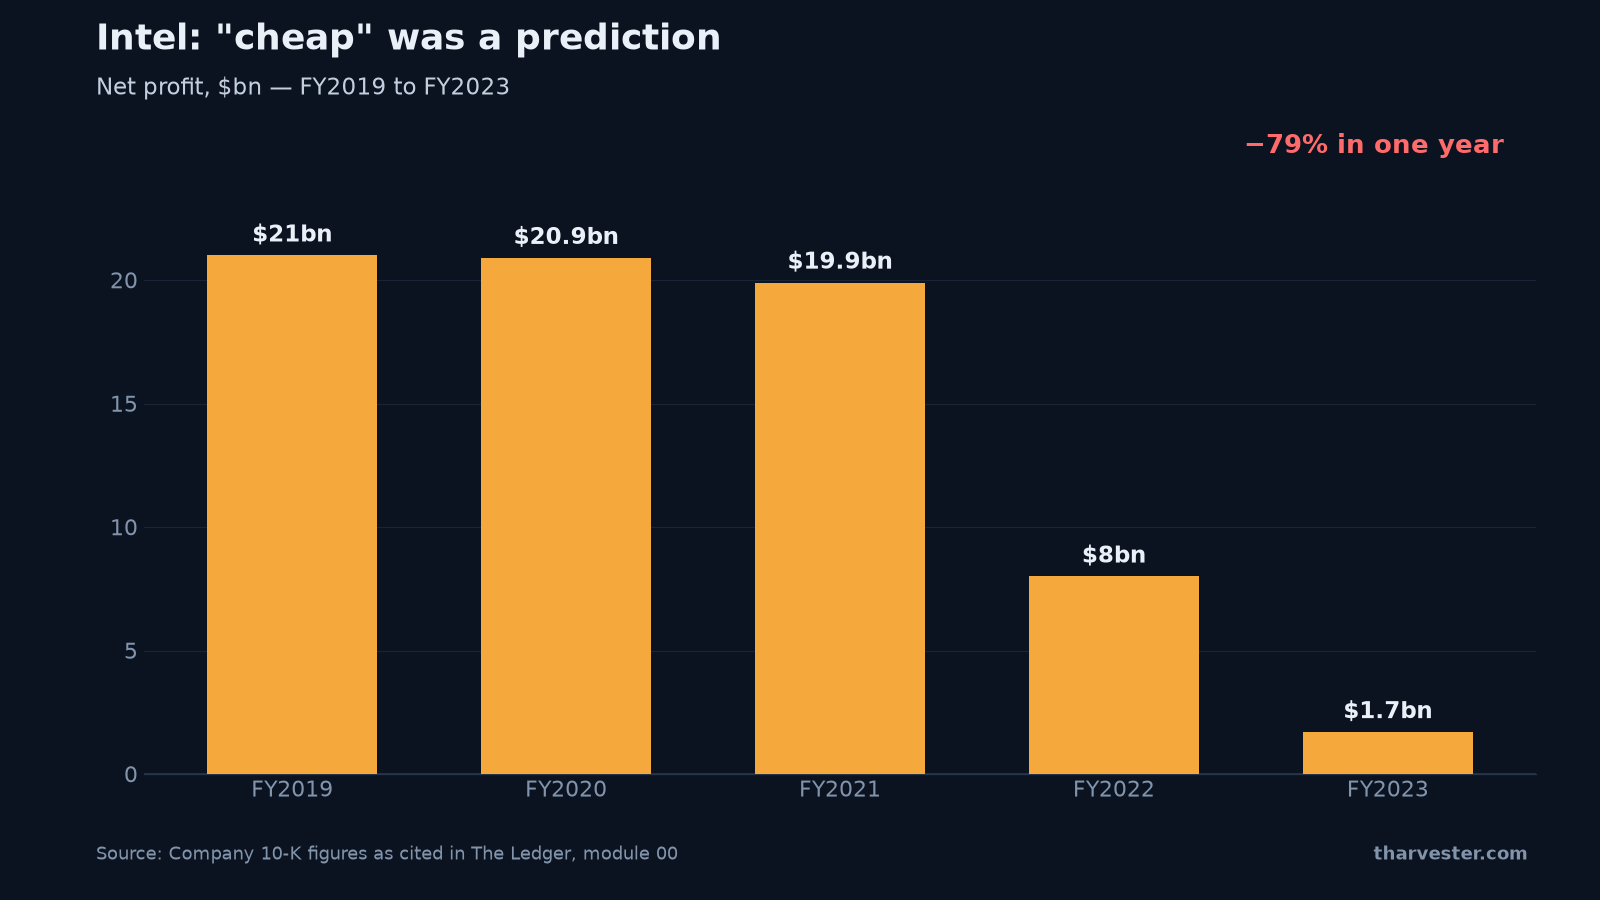
The chart above shows why the most common shortcut fails. It plots Intel's reported net profit by fiscal year, and the story is a cliff: roughly $21.0bn in FY2019, still $19.9bn in FY2021, then $8.0bn in FY2022 and just $1.7bn in FY2023 — a fall of about 79% in the final year.
In 2023, Intel's shares looked cheap on the price-to-earnings ratio — the share price divided by profit per share. But the ratio was measuring the price against a profit number in free fall. Inside the business, the data center division sold $15.5bn in FY2023 against $19.4bn the year before, swinging from a $1.3bn operating profit to a $530m operating loss, with server chip volumes down 37%.
So the "cheap" reading was really a forecast in disguise. Anyone buying on the low ratio was predicting that Intel would win back the ground it was losing to competitors. Maybe right, maybe wrong — but it was a claim about the future, and it needed its own evidence. The ratio was not the argument. It was the starting point for one.
Three ways to be right
There are only three ways to make money from analysis, and it pays to know which one you are attempting.
- You disagree about the numbers. You think sales, margins or cash will come in differently from what everyone expects — and you turn out to be right. Hardest to do, most valuable when you do it.
- You disagree about what the numbers are worth. You accept the consensus forecast but believe the market is paying the wrong price for it — misjudging how durable the business is, where it sits in its industry's cycle, or how much debt it carries. Most large re-pricings, up and down, happen here.
- You are simply more patient. You agree with everyone about the destination, but you can hold through a bad two years that other people cannot. This edge is free to acquire and very hard to keep.
Each of the three is a variant perception — a specific view that differs from the one embedded in the price. If you cannot name yours, you are paying the market's price for the market's own forecast, and your expected edge is zero.
See the forecast inside a price
You can make the hidden forecast visible. The interactive below is the Expectations Lab from the course — it runs the machine in reverse.
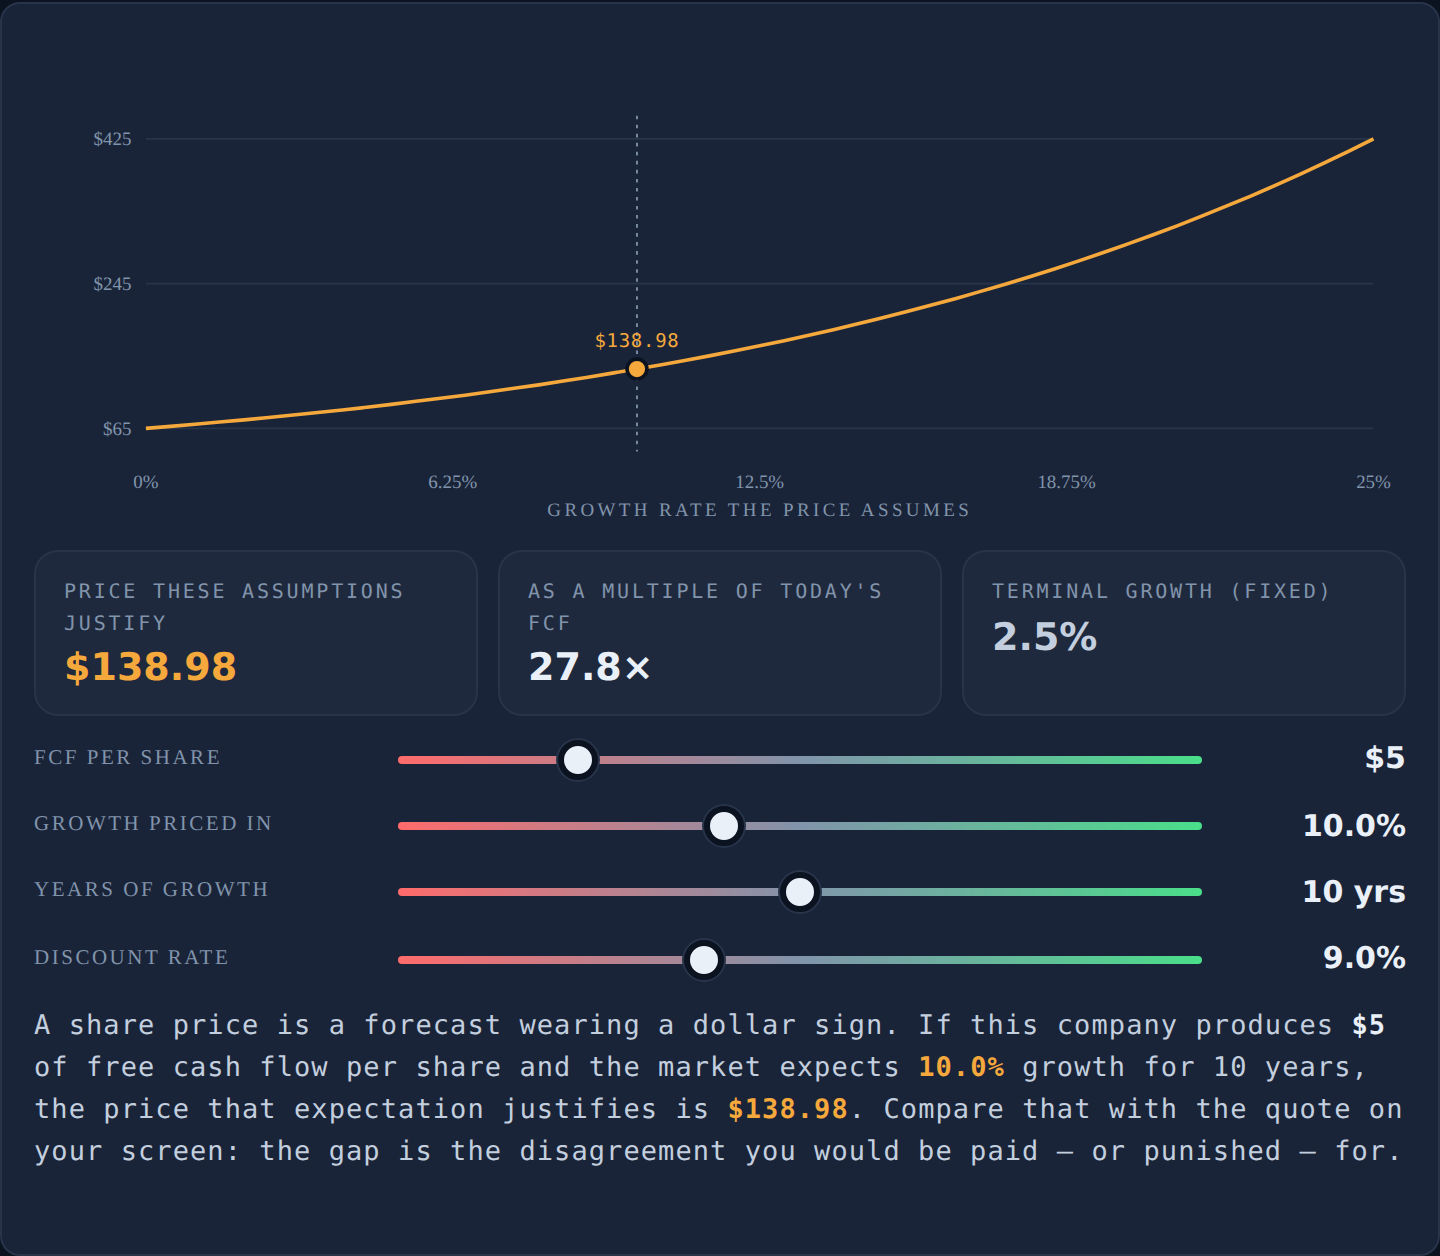
Four sliders: free cash flow per share ($1–$20), the growth the price assumes (0–25% a year), the years of growth (5–15), and the discount rate (6–14%) — the annual return you demand for waiting and taking risk. The readouts show the share price those assumptions justify, and the multiple of today's free cash flow it equals. The chart draws the justified price across the whole growth range, with a marker at your setting.
Try this: set $5 of free cash flow per share and 5% growth, then drag growth to 20%. Watch the justified price multiply — and notice how far apart the prices are for assumptions that all sound plausible. Now you know what a "high multiple" literally is: a price that has wandered far up that curve, betting on years of fast growth. Your job is to decide whether the bet at the marker is too easy or too hard.
Why every number gets two readings
Most investment writing exists to encourage buying. Banks earn fees from the companies they cover, most funds can only buy, and saying "buy" costs a career less than saying "sell". That slant leaks into education: you are told a low P/E means "cheap" and a high return on equity means "good".
Neither statement is complete. Both are true only under certain conditions — and those conditions are the entire subject. So the course reads every metric twice: the reading that supports buying, and the reading that supports selling or avoiding. Intel's low P/E was either a bargain (the market panicking about a fixable slump) or a value trap (a fair price for a business losing its market). Same number, opposite conclusions, and the work is deciding between them. Before you use any figure in an argument, write down both readings — if you cannot state the opposite case with the same number, you have only picked a side.
Why shorting is not buying in reverse
Betting against a company — short selling, borrowing shares, selling them, and buying them back later at a hopefully lower price — sounds like buying flipped upside down. It is not, for four reasons.
- The math is lopsided. A buyer risks 100% with unlimited upside. A short seller's gain caps at 100%, with no upper limit on the loss.
- The market drifts upward. Over long periods stock markets tend to rise — inflation, reinvested profits, buybacks. A short must fall faster than the market climbs.
- Waiting costs money. You pay a borrow fee, and you pay any dividends to the lender of the shares. Time works against you.
- Optimism can rescue the company. A business running out of cash can sell new shares at a high price and refill its bank account. The optimism you bet against fixes the problem you identified.
The practical rule: "it is too expensive" is never a short thesis. A short needs a specific event that forces the price down — a loan that cannot be refinanced, a patent expiring, a big customer leaving, an accounting correction — and ideally a rough date. Bearish work is usually best expressed with a position that has a fixed maximum loss and a deadline, not an open-ended short sale.
Where to go from here
This article is the companion to Module 00 of The Ledger, which adds drills — including writing down what a real price is predicting — and a short quiz. The full fundamental analysis course runs seventeen modules, every metric read from both sides, with a glossary for any term you meet along the way.
The forecast lives in the price; the evidence lives in the accounts. The next article, how the three financial statements connect, shows you the three pages every number in this course is pulled from. And when you want the machine to read a real ticker's numbers for you, the Fundamentals Grader scores any symbol against its sector peers in seconds.
Start Module 00: What you are actually doing →
Frequently asked questions
What does a stock price actually represent?
A stock price is the market's best estimate of every future cash flow the business will produce for its owners, discounted back to a value today. It is where thousands of buyers' and sellers' opinions balanced out. It is a prediction about the future, not a verdict on the company's current quality.
What is fundamental analysis in simple terms?
Fundamental analysis is reading a company's reported numbers — sales, profits, cash, debts — to work out what the business is worth, and comparing that to what the market is charging. The goal is not to find good companies. It is to find prices that assume a future that is too optimistic or too pessimistic.
Can a good company be a bad investment?
Yes, and it happens constantly. If the price already assumes the company will be wonderful, you only make money if reality beats that assumption. A struggling company priced for disaster can be the better investment, because struggling slightly less than expected is enough to move the price up.
What is a variant perception in investing?
A variant perception is a specific, defensible view that differs from what the price implies. There are three kinds: you disagree about the numbers the company will report, you disagree about what those numbers are worth, or you agree on the destination but can hold through a rough stretch that others cannot. Without one of the three, you are paying the market's price for the market's own forecast.
Does a low P/E ratio mean a stock is cheap?
Not by itself. A low price-to-earnings ratio is a prediction that profit will fall. Intel in 2023 looked cheap on P/E while its net profit dropped about 79% to $1.7bn — buyers of the low ratio were implicitly betting on a recovery that needed its own evidence. The ratio is the start of an argument, not the argument.
Is 'overvalued' a good reason to short a stock?
No. Expensive stocks can stay expensive for years and often get more expensive first, while borrow fees and dividends drain the position. A short thesis needs a specific event that forces the price down — a debt refinancing, a patent expiry, a lost customer, an accounting correction — and ideally a rough date for it.
Why is short selling riskier than buying shares?
Four asymmetries. Buying risks 100% with unlimited upside; shorting caps the gain at 100% with unlimited loss. Markets drift upward over time, so a short fights the tide. Borrowing shares costs a fee and any dividends while you wait. And a troubled company can sell new shares into optimism, using the high price to fix the very problem you identified.
What are the three ways to beat the market with analysis?
Disagree about the numbers and be right — the hardest and most valuable. Disagree about what the numbers are worth, because the market has misjudged durability, cycle position, or debt — where most big re-pricings happen. Or be more patient than other holders, agreeing on the destination but tolerating a bad two years that forces others out.