Wheel Strategy Tracker That Replaces Your Options Spreadsheet
If you're running the wheel strategy, you already know the lifecycle: sell a cash-secured put, get assigned, sell covered calls against the shares, get called away, repeat. The strategy itself isn't complicated. Tracking it properly is.
Most options traders don't. They sell a put, collect premium, and maybe jot it down somewhere. Three months and eight legs later, they have no idea what their actual cost basis is. They don't know if the SOFI wheel they've been running since November is outperforming the SLV wheel they started in September. They don't know their annualized return on any of it.
An options wheel spreadsheet helps, but spreadsheets break. You forget to log a leg, the formulas get tangled, and by the time you've manually calculated cost basis after three covered call rolls and a dividend, you've spent more time tracking than trading.
This is the problem the Wheel Strategy Tracker in ThetaHarvester was built to solve. It tracks every leg of every cycle, calculates your rolling cost basis automatically, and — unlike any spreadsheet or options trading journal — analyzes your patterns and tells you what you're doing wrong.
What Is a Wheel Strategy Tracker?
A wheel strategy tracker follows a single wheel cycle as one entity — from the moment you open a cash-secured put to the moment your shares get called away (or you exit manually). Every leg along the way is logged, and the cost basis recalculates automatically after each one.
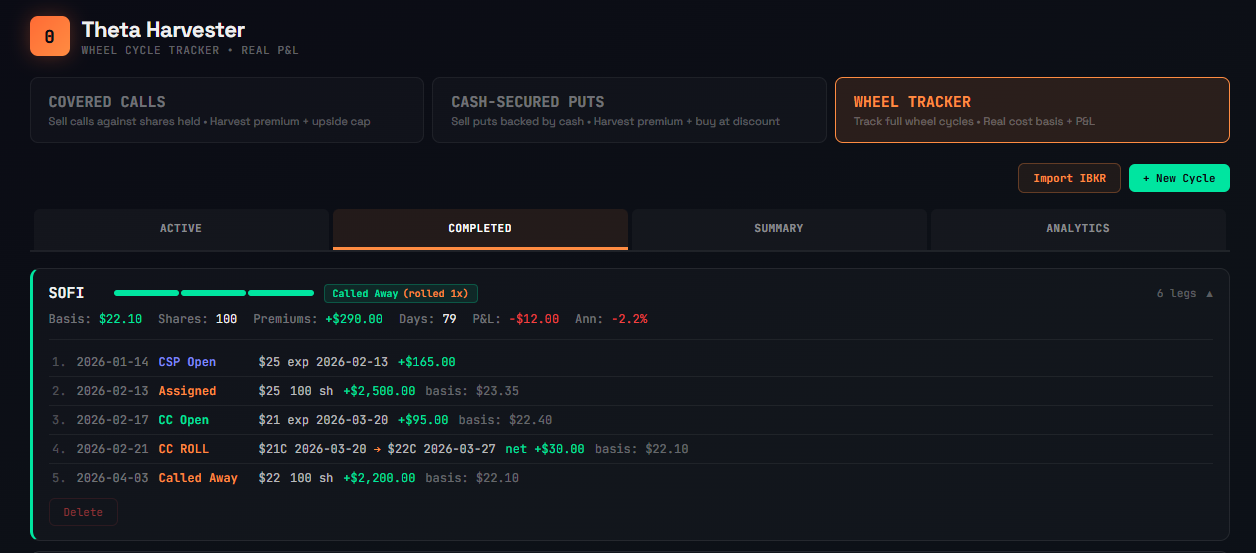
A cycle might look like this:
- CSP Open — SOFI $25 put, Feb expiration, collected $1.65/share
- Assigned — bought 100 shares at $25, effective basis: $23.35
- CC Open — $21 call, Mar expiration, collected $0.95/share, basis drops to $22.40
- CC Roll — rolled $21C Mar → $22C Mar, net credit +$0.30, basis drops to $22.10
- Called away — shares sold at $22, cycle complete
Five legs, one cycle, one ticker. The tracker ties them all together and shows your rolling cost basis at every step. Notice leg 4 — that's a roll, displayed as a single line with the net credit or debit, not two confusing separate entries.
Most options trade trackers treat each option as an independent event. A wheel strategy tracker understands that these legs are connected — CSPs lead to assignments, assignments lead to covered calls, and the cost basis threads through all of them.
How Rolling Cost Basis Works in the Wheel
Cost basis is the single most important number in a wheel cycle. It tells you what you effectively paid for your shares after accounting for every premium collected, every roll, every fee.
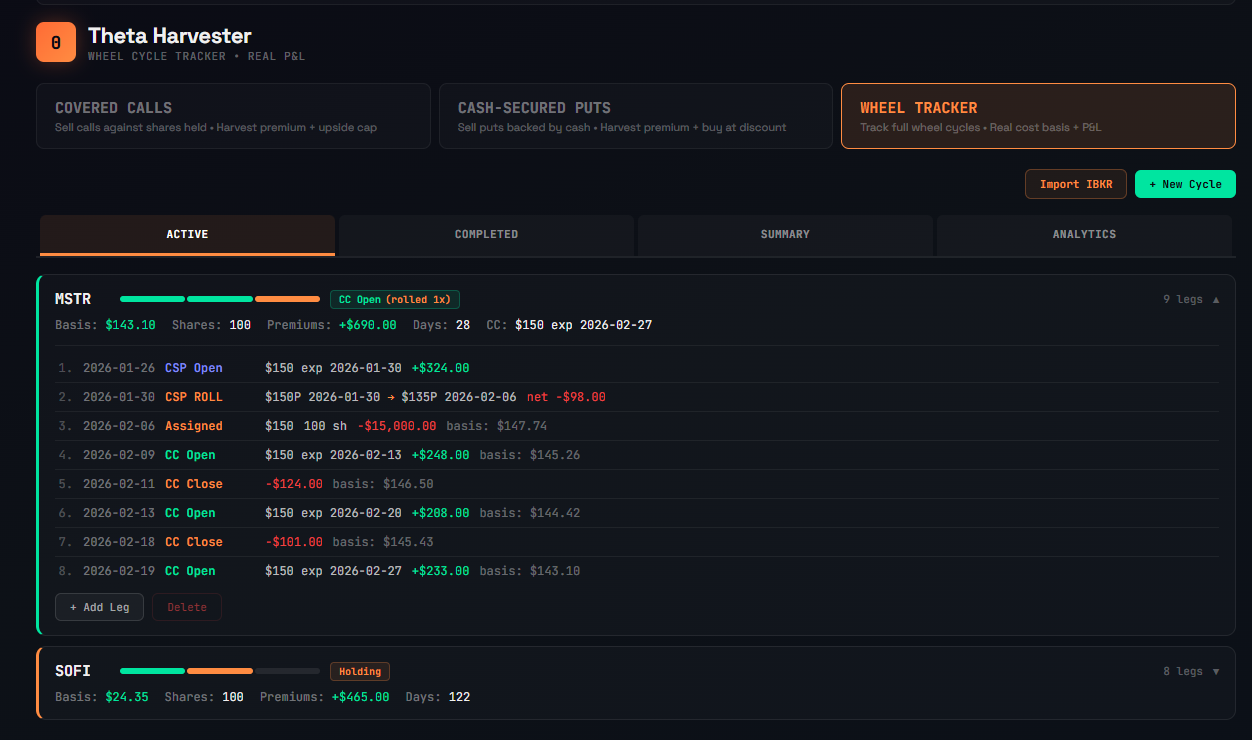
Here's how it evolves through a real MSTR cycle tracked in the app:
After CSP open: No shares yet. Premium of $324 collected and waiting.
After CSP roll: Rolled the $150 put from Jan to Feb at a $98 debit. Net premium is now $226. Still no shares.
After assignment at $150: Bought 100 shares. Cost basis: $150 - $2.26/share = $147.74.
After first CC (+$248): Basis drops to $145.26.
After CC close (-$124): Bought back the call at a cost. Basis rises to $146.50.
After second CC (+$288): Basis drops to $144.42.
After second CC close (-$101): Basis rises to $145.43.
After third CC (+$233): Basis drops to $143.10.
Nine legs deep. The tracker calculated every cost basis adjustment automatically. You didn't touch a formula. You just logged what happened and the numbers updated. Try doing that in a covered call spreadsheet without introducing an error.
How to Track Covered Call Rolls Automatically
Rolling is one of the most common actions in wheel management, yet most options trading journals force you to log it as two separate entries — close the old option, open the new one — and mentally stitch them together.
The Wheel Strategy Tracker treats rolls as a single action. When you click "Add Leg" on a cycle with an open CC or CSP, you'll see a Roll option. It opens a modal that captures:
- The closing cost of the current option
- The strike, expiration, and premium of the new option
- Fees on both sides
The net credit or debit is calculated live as you type. One confirmation creates both legs atomically — no half-rolled states, no forgotten second halves.
In the leg history, a roll shows as one line:
4. Feb 21 CC ROLL $21C 2026-03-20 → $22C 2026-03-27 net +$30.00 basis: $22.10
The cycle card also shows a roll count — "CC Open (rolled 1×)" — so you can see at a glance how many times a position has been adjusted. A cycle with six rolls tells a very different story than one with zero.
Starting and Managing Wheel Cycles
How to Start a New Cycle
There are two ways to begin tracking:
From the planning tool: If you've already graded a cash-secured put setup in ThetaHarvester and saved it to your portfolio, there's a TRACK button right in the positions table. Click it, and the tracker pre-fills the ticker, strike, expiration, and premium from your saved setup. Adjust the premium to your actual fill price and click "Create Cycle."
Manual entry: Click "+ New Cycle" in the Wheel Tracker tab. Enter the ticker, select "Cash-Secured Put", fill in your strike, expiration, premium, trade date, and fees. If you already own shares and want to start selling covered calls, select "Already own shares" and enter your purchase price.
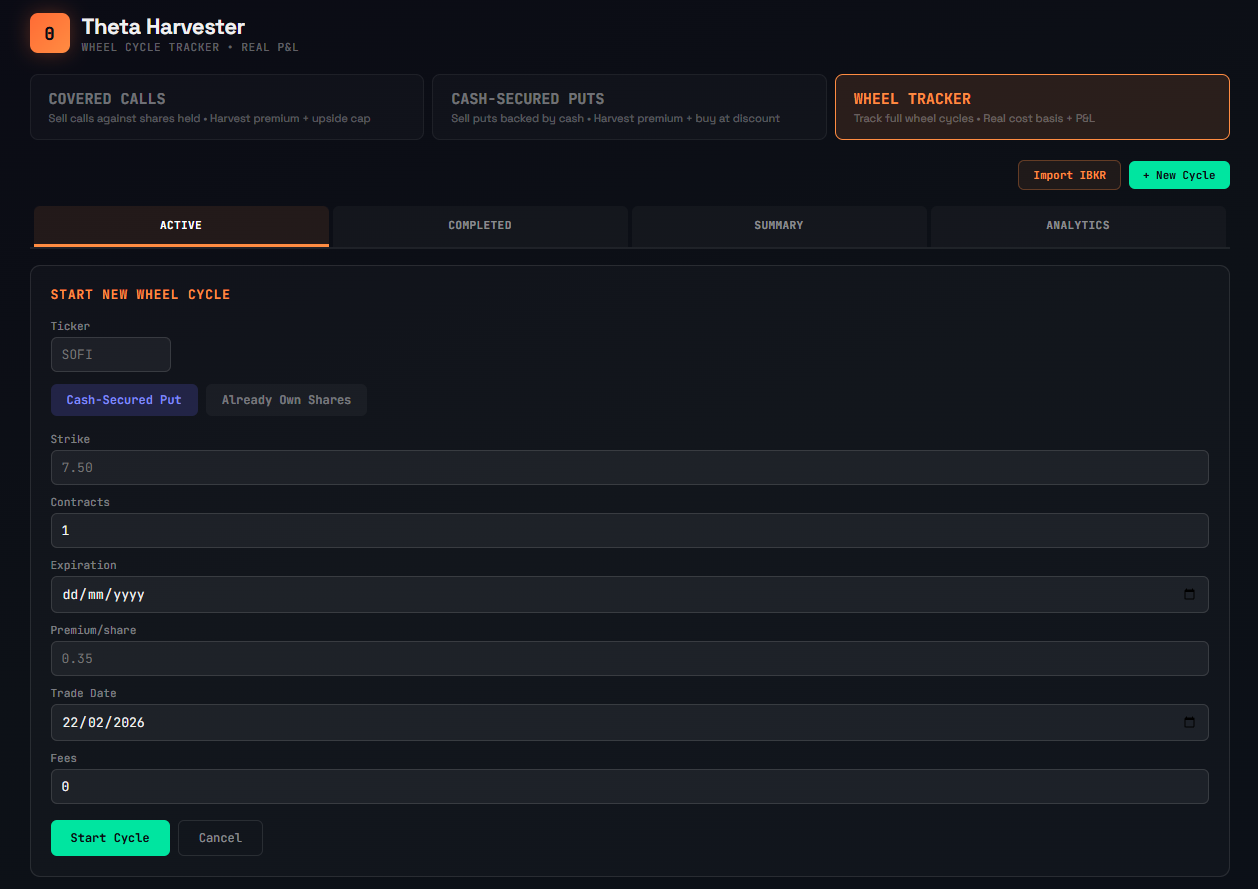
The cycle is now active and visible in the ACTIVE tab.
Adding Legs as the Cycle Progresses
Each active cycle has an "Add Leg" button. The options shown depend on where you are in the cycle:
If your CSP is open: Mark it as expired worthless, close it early (enter buyback price), roll it to a new strike/expiration, or log assignment.
If you're holding shares: Sell a covered call, add a dividend, or sell shares to exit manually.
If your covered call is open: Mark it as expired, close it early, roll it, or log it as called away.
The tracker enforces the correct order. You can't sell a covered call while a CSP is still open. You can't add a dividend if you don't hold shares. This state machine prevents the logging errors that break cost basis calculations in spreadsheets.
Watching the Numbers Update in Real Time
After each leg, the cycle card in the ACTIVE tab updates:
- Cost basis drops as premiums accumulate (or rises after buybacks)
- Total premiums shows the running sum of all income collected
- Days in cycle counts from the first leg
- Progress bar shows visually where you are: CSP phase → holding → CC phase
Expand the cycle to see the full leg history with cost basis after each step. This is your audit trail — every trade, every premium, every roll, every adjustment, all in one place.
Tracking Completed Wheel Cycles and P&L
When a cycle completes — CSP expires worthless, shares get called away, or you exit manually — it moves to the COMPLETED tab.
Each completed cycle shows:
Realized P&L: The actual profit or loss, accounting for every premium collected, every buyback cost, assignment price, sale price, dividends, and fees. No estimates. Real numbers.
Annualized return: P&L relative to capital deployed, scaled to a yearly rate. A $320 profit on $2,500 of capital over 109 days isn't just 12.8% — it's 38.3% annualized. This number tells you how efficiently your capital worked.
Days held: Total duration from first leg to last. Shorter cycles with the same return are better — capital turns over faster.
![]()
The mix of outcomes is honest. You'll see CSPs that expired worthless for full profit, CSPs closed early at a loss, and full wheel cycles that ran through assignment and covered calls before getting called away. The losers are just as visible as the winners — because hiding them doesn't improve your trading.
Completed cycles stay in your history permanently. Over months of trading, this table becomes your options trading journal — sortable by ticker, return, duration, or P&L.
Options Portfolio Dashboard: Summary Metrics That Matter
After a few months of tracking, the Summary tab becomes the most valuable screen in the app. It answers the question every options income trader should be asking: is this strategy actually working?
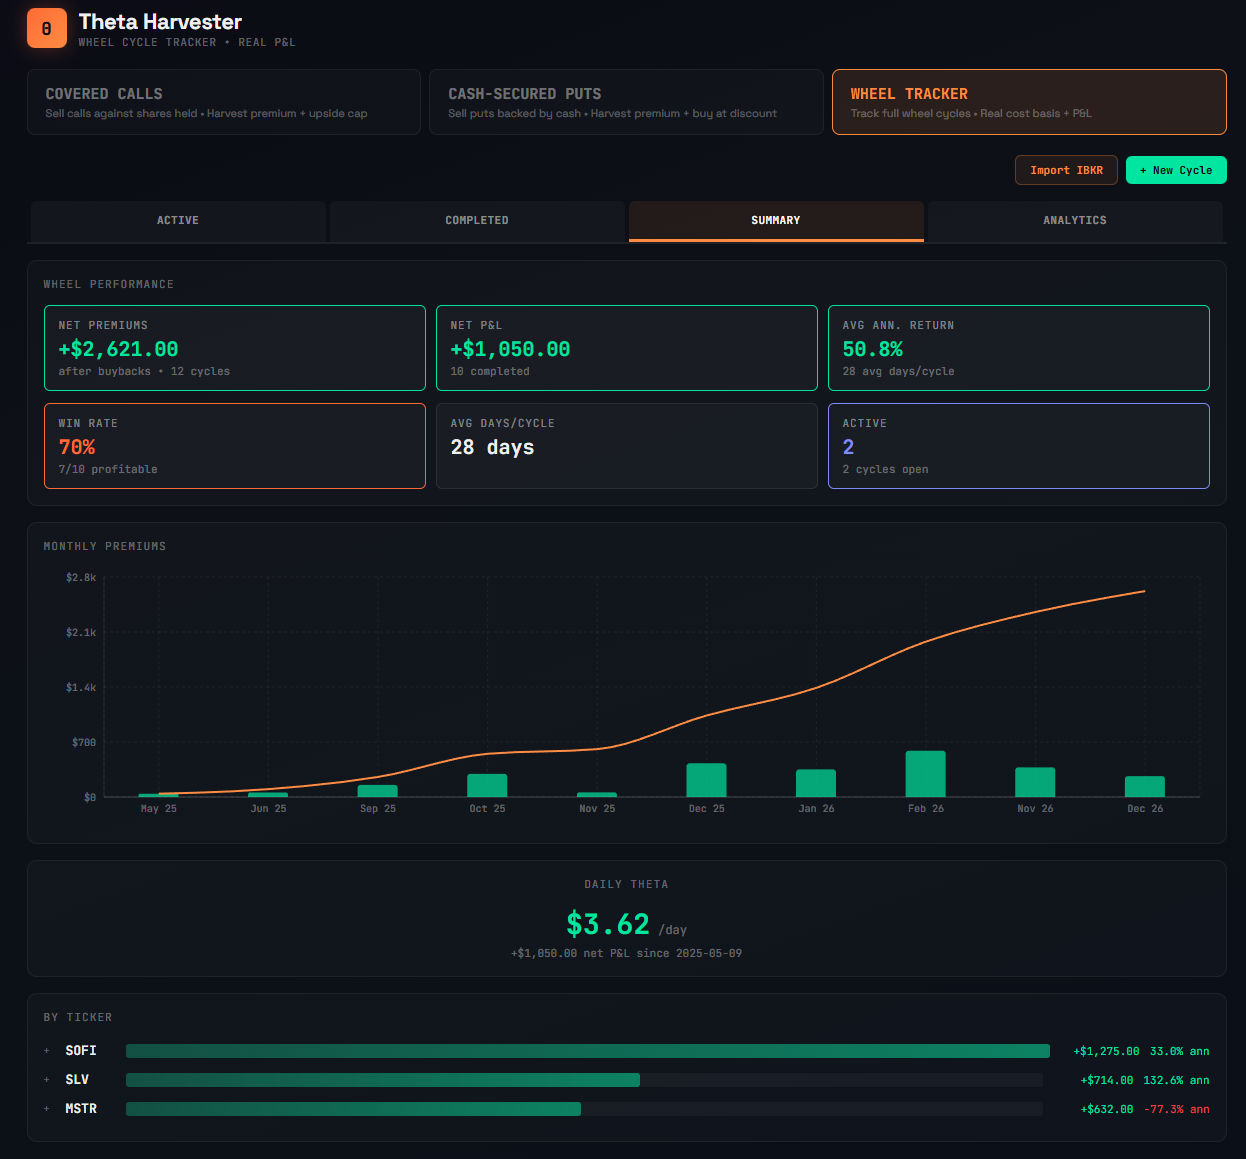
Net premiums — total premium income after buybacks across all cycles. Not gross collected — net of every buyback, so there are no inflated numbers.
Net P&L — premiums plus capital gains minus fees. The real bottom line.
Win rate — percentage of cycles that closed profitably. Most disciplined wheel traders land between 75-90%.
Average annualized return — your blended return across all completed cycles, weighted by capital deployed and time.
Average days per cycle — how fast your capital is turning over. Shorter is better, all else equal.
Daily theta — your net P&L divided by total days since your first trade. This is the number that makes the strategy tangible: not "I made $1,062 in 10 months" but "$3.66 per day, every day."
Performance by ticker — which underlyings are working best and which are dragging. Maybe your SOFI wheel averages 44.7% annualized but your MSTR wheel is running at -77.3% because of an underwater position. That data should change how you allocate capital next month.
Monthly premiums chart — green bars showing net premiums collected per month with an orange cumulative line climbing to the right. This is the chart that makes the strategy feel real. Watching the bars grow month over month is what keeps you disciplined through the flat months.
Options Trading Analytics: Automated Pattern Detection
This is where the Wheel Strategy Tracker goes beyond any options trading journal or spreadsheet. The Analytics tab analyzes every leg, every cycle, every pattern in your trading history and surfaces the kind of insights you'd pay a trading coach $200/hr to tell you.
Coaching Flags That Catch Your Trading Mistakes
The flags are specific observations generated from your actual data — not generic tips copied from a blog post:
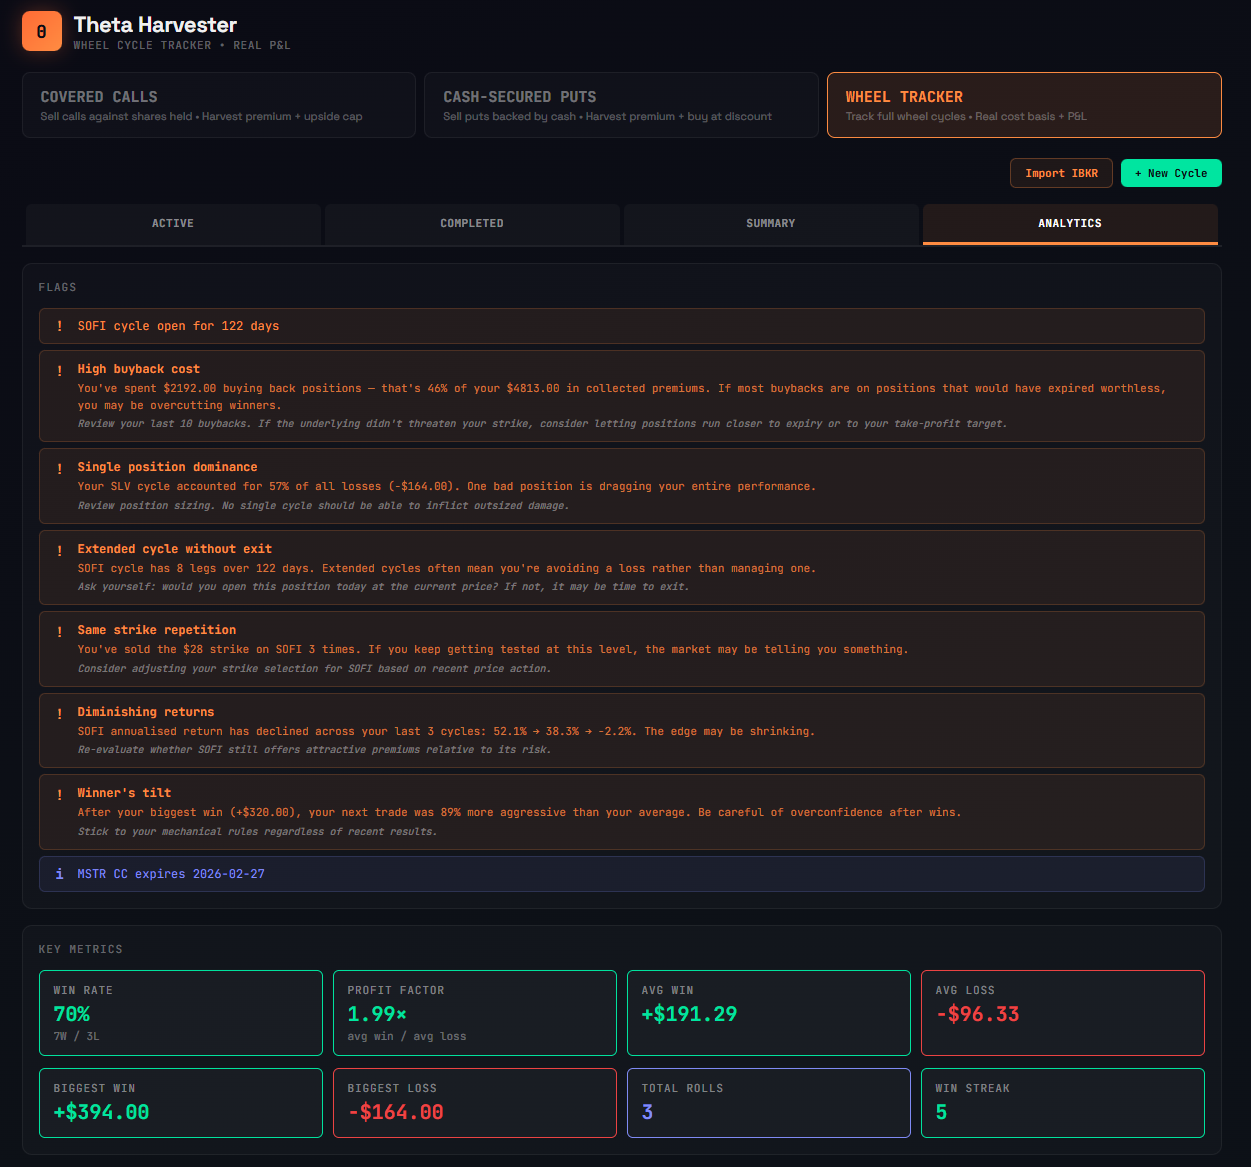
High buyback cost: "You've spent $2,192 buying back positions — that's 46% of your $4,813 in collected premiums. If most buybacks are on positions that would have expired worthless, you may be overcutting winners." It suggests reviewing your last 10 buybacks and considering letting positions run closer to expiry.
Extended cycle without exit: "SOFI cycle has 8 legs over 122 days. Extended cycles often mean you're avoiding a loss rather than managing one." The prompt: ask yourself if you'd open this position today at the current price. If not, it may be time to exit.
Same strike repetition: "You've sold the $28 strike on SOFI 3 times. If you keep getting tested at this level, the market may be telling you something."
Winner's tilt: "After your biggest win (+$394), your next trade was 89% more aggressive than your average. Be careful of overconfidence after wins." This is a behavioral pattern most traders never notice in themselves — and no spreadsheet will ever flag it.
The flags update with every new leg. They have minimum data thresholds — most need 5+ completed cycles before appearing — so they don't fire on insufficient data. And they include positive reinforcement too: clean streaks, improving win/loss ratios, and consistent monthly income patterns.
Key Metrics for Options Traders
Below the flags, a metrics grid surfaces the numbers every options trading journal should track:
- Win rate — wins vs losses across completed cycles
- Profit factor — average win ÷ average loss. Below 1.5× means a single large loss can wipe several wins.
- Average win / average loss — the size asymmetry that determines whether your edge compounds
- Biggest win / biggest loss — your extremes. If biggest loss dwarfs biggest win, your risk management has a hole.
- Total rolls — how often you're adjusting positions
- Win streak — your current run of profitable cycles
Charts That Reveal Your Trading Patterns
The analytics charts answer questions you should be asking but probably aren't:
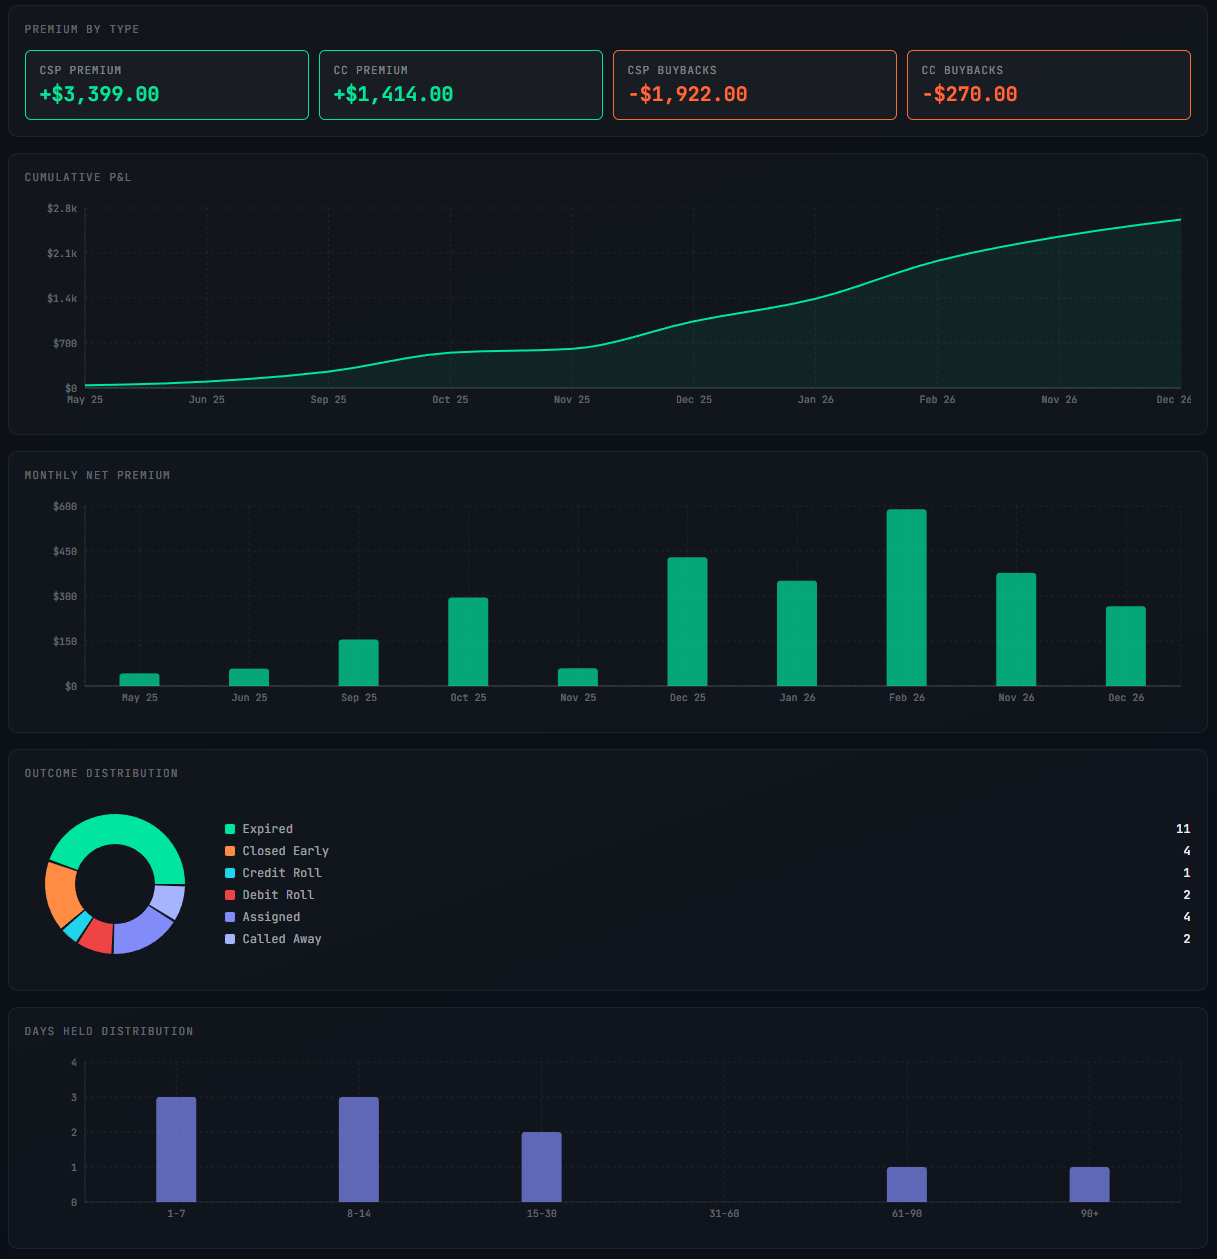
Premium by type: Four boxes breaking down CSP premium, CC premium, CSP buybacks, and CC buybacks. When you see +$3,399 in CSP premium but -$1,922 in CSP buybacks, you immediately know where your premium leakage is.
Cumulative P&L: A line chart showing your equity curve from day one. The slope and smoothness tell you whether your strategy is grinding upward consistently or lurching between wins and losses.
Monthly net premium: Bar chart showing income per month. Are your best months getting better? Are there seasonal patterns? Did that December spike come from a one-off or a repeatable setup?
Outcome distribution: A donut chart showing how every option position resolved — expired, closed early, credit roll, debit roll, assigned, or called away. A donut dominated by expirations means clean strike selection. Heavy on debit rolls means you're frequently paying to rescue positions. This is a visual fingerprint of your options trading style.
Days held distribution: How long your positions typically last. Clustering at 1-7 and 8-14 days with a few outliers at 90+ tells a different story than an even spread. The outliers are usually the problem children — extended cycles the flags are warning you about.
Tracking Dividends and Fees in the Wheel
Two things that options wheel spreadsheets always get wrong:
Dividends reduce your cost basis further. If you're holding shares in a dividend-paying stock as part of a wheel cycle, logging the dividend updates your basis. Collect $0.15/share in dividends on your 100 shares, and your basis drops by $0.15. Small per cycle, meaningful over a year of wheel trading.
Fees work the other way — they increase your effective cost. The tracker accumulates fees from every leg and factors them into the final P&L. That $0.65 per contract commission on every open and close adds up across dozens of legs.
Importing Options Trades From Interactive Brokers
If you've been running the wheel and have a history of trades sitting in your broker, you don't need to enter them one by one.
The Wheel Strategy Tracker supports IBKR CSV import. Export your activity statement from Interactive Brokers, upload it, and the tracker reconstructs your cycles automatically — matching puts to assignments, assignments to covered calls, and covered calls to final exits.
You'll see a preview of the detected cycles before anything is saved. Review the matches, handle any unmatched trades, and confirm. Your entire options trading history populates the tracker in one step.
Wheel Strategy Tracker vs Options Wheel Spreadsheet
Spreadsheets work until they don't. Here are the failure modes that make a dedicated wheel strategy tracker worth it:
Forgetting to log a leg. You close a covered call, open a new one, and forget to update the sheet. Now your cost basis is wrong for every subsequent calculation in that cycle.
Formula errors. Cost basis after three CC rolls, a dividend, and two buybacks is a formula most people get wrong at least once. One wrong cell propagates through everything below it.
No enforcement of order. A spreadsheet lets you enter anything anywhere. The tracker enforces the state machine — you can't log a CC sale if you haven't been assigned yet. This prevents the data entry mistakes that silently corrupt your cost basis.
No roll handling. A spreadsheet has no concept of a roll as a single action. You log two separate trades and mentally connect them. The tracker captures both sides atomically and shows the net credit/debit in one line.
No automated analysis. A spreadsheet will never tell you that your buyback costs are eating 46% of your premiums, or that you get more aggressive after big wins, or that you've sold the same strike three times in a row. The analytics engine surfaces these patterns automatically.
No aggregation. Summing up total performance across 12 cycles on 3 tickers in a spreadsheet is a project. The tracker calculates daily theta, annualized returns, win rate, and by-ticker breakdowns without you lifting a finger.
No portability. Your spreadsheet lives on one device. The tracker syncs across devices and persists in the cloud.
The spreadsheet is a general-purpose tool forced into a specific workflow. The Wheel Strategy Tracker is built for exactly one thing: following wheel cycles from open to close with correct cost basis at every step — and then analyzing what the data means.
Frequently Asked Questions
How do I track my wheel strategy?
The most reliable way to track the wheel strategy is with a dedicated tracker that follows each cycle as one entity — from the initial cash-secured put through assignment, covered calls, and final exit. The tracker should calculate rolling cost basis after every leg, handle rolls as a single action, and aggregate your performance across all cycles. You can use a spreadsheet, but dedicated tools like ThetaHarvester prevent the formula errors and missed entries that make spreadsheets unreliable over time.
How do you calculate cost basis on the wheel strategy?
Your cost basis starts at the assignment price and decreases with every premium collected. If you sold a $25 put for $1.65 and got assigned, your initial basis is $25 - $1.65 = $23.35. Each covered call premium, dividend, and credit roll reduces it further. Buybacks and debit rolls increase it. The formula gets complex after several legs — which is why automated tracking prevents errors that compound across a multi-month cycle.
What is the best wheel strategy tracker?
The best wheel strategy tracker should handle the full lifecycle (CSP → assignment → CC → called away), calculate rolling cost basis automatically, treat rolls as single actions, support broker import (IBKR CSV), and provide analytics beyond basic P&L. ThetaHarvester's Wheel Tracker does all of this, plus automated coaching flags that detect patterns like excessive buybacks, same-strike repetition, and behavioral biases in your trading.
Can I import my existing trades into a wheel tracker?
ThetaHarvester supports IBKR CSV import. Export your activity statement from Interactive Brokers, upload it, and the tracker reconstructs your wheel cycles automatically — matching puts to assignments, assignments to covered calls, and covered calls to exits. You review the detected cycles before confirming. Your entire trading history populates in one step.
Is the wheel strategy tracker better than a spreadsheet?
For tracking a few simple cycles, a spreadsheet works fine. But as you scale to multiple tickers, add rolls, dividends, and buybacks, spreadsheets break down. The most common failures: forgotten legs that corrupt cost basis, formula errors after rolls, no enforcement of trade order, and no automated performance analysis. A dedicated tracker prevents all of these and adds analytics that spreadsheets can't replicate — like detecting behavioral patterns across dozens of completed cycles.
Try It Yourself
The Wheel Strategy Tracker is available in ThetaHarvester Pro. It lives alongside the planning tools — grade a setup, save it, then click TRACK to start following the cycle. Every leg, every premium, every roll, every cost basis adjustment logged and calculated automatically.
Import your IBKR history to backfill existing cycles, or start fresh with your next CSP. The analytics engine starts surfacing coaching flags once you have 5+ completed cycles — the more you trade, the smarter it gets.
Free users can explore the grading and analysis tools using demo tickers (AAPL, SPY, TSLA, NVDA, QQQ, MSFT). The Wheel Strategy Tracker is a Pro feature — $29/mo or $249/year.
If you're new to the wheel strategy, start with our complete guide to running the wheel mechanically. Already running it? Stop guessing your cost basis and start tracking it.