Capital Cycle Investing — How Industry Capex Predicts Returns
Short answer: Capital cycle investing tracks money flowing into and out of an industry's capacity. High returns attract capital, capital builds factories on a two-to-four-year delay, the new supply arrives all at once and crushes prices, then capital flees and scarcity rebuilds returns. The tell is public: divide industry capex by industry depreciation. Above 1.5 and rising means a glut is being built; below 1 for years means supply is quietly shrinking and a recovery is being set up.
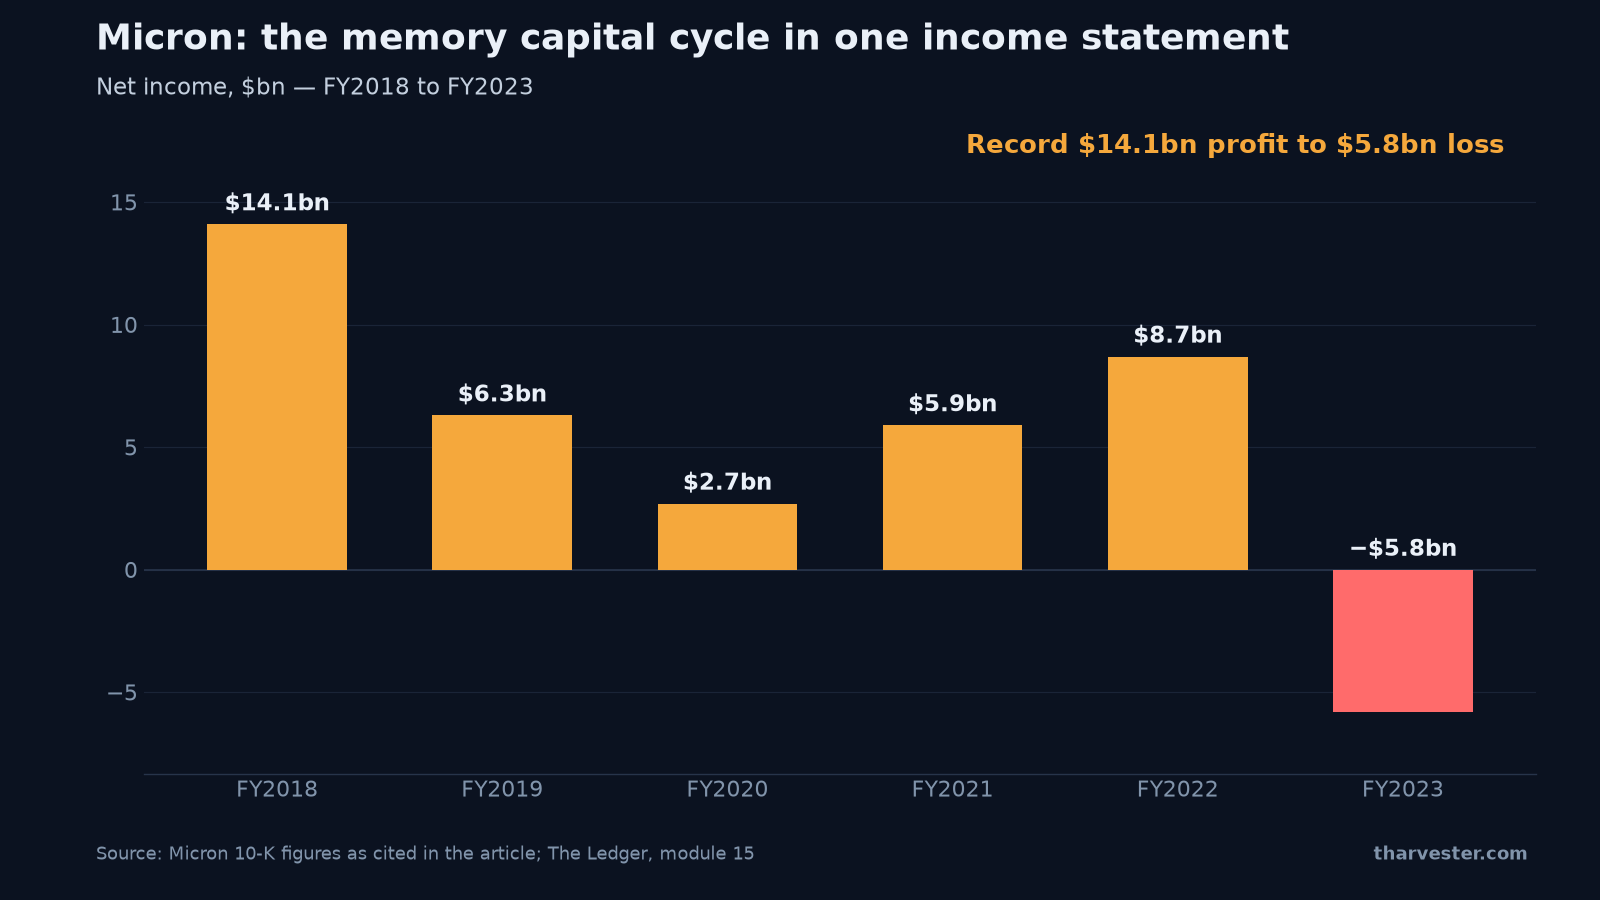
In fiscal 2018, Micron reported $14.1 billion of net income — a record. In fiscal 2023, the same company, in the same business, with much of the same management, reported a $5.8 billion net loss. Nothing about Micron's execution explains a swing that size. The memory chip industry does this roughly once a decade, and the mechanism has a name: the capital cycle.
Capital cycle investing is the discipline of reading that mechanism before it plays out — and it is the single most useful pattern taught in The Ledger, ThetaHarvester's free fundamental analysis course. This article covers module 15, The industry sets the ceiling: why structure beats effort, how industry capex predicts returns years in advance, and which sector-specific numbers actually move a stock's multiple.
What is capital cycle investing?
Some industries let almost every participant earn good returns for decades. Others grind everyone down to barely covering their cost of capital — the return investors demand for funding the business — however well run each company is. The difference is structural, and it puts a ceiling on what any company inside the industry can achieve.
The capital cycle explains most large moves in industries that own physical assets. It runs as a sequence:
- An industry earns unusually high returns, for whatever reason.
- Those returns attract money — existing players expand and new entrants arrive.
- The money builds capacity: factories, ships, mines, data centers. This takes two to four years.
- The new capacity arrives roughly all at once. Supply exceeds demand, prices fall, and returns collapse.
- Money leaves. Expansion stops, weak competitors exit or get bought, and existing capacity wears out without being replaced.
- Supply tightens, prices recover, and the cycle begins again.
The chart above shows the sequence in one company's income statement. Memory chips earned spectacular returns into fiscal 2018; the industry built capacity through the shortage years; and by fiscal 2023 the new supply had arrived into softening demand, turning Micron's $8.7 billion fiscal 2022 profit into a $5.8 billion loss one year later. Read left to right, that is steps 1 through 4 with real dollar signs attached.
The critical point for an investor: steps 2 and 3 are public. Companies announce expansions, order equipment and apply for permits years before the capacity produces anything. You can read the next downturn in competitors' own press releases.
Porter's five forces for stocks, asked as plain questions
Before the cycle, check the structure. Five questions do the work of a strategy textbook:
- How many competitors, and how big? Add up the market share of the four largest players — the concentration ratio. If the top four hold a growing share over a decade, margins tend to expand, because nobody needs to start a price war. A fragmenting industry competes its own profits away.
- How hard is it to enter? Barriers can be capital, regulation, distribution, a brand, or scale. The test: could a well-funded competitor replicate this with money alone? If yes, current returns are temporary.
- How much power do suppliers have? A single source for a key component, or one dominant chip vendor, means the supplier captures the profits.
- How much power do customers have? A few large buyers, competitive tenders, transparent pricing and low switching costs all push profit toward the customer.
- What could replace the product? Including the option of doing nothing, and the technology that has not arrived yet.
An industry that fails several of these has a low ceiling. As the module's closing rule puts it: structure first, then selection.
The industry capex cycle: one ratio that reads the future
Here is the check the course drills. Take the whole industry — your company plus its main competitors — and pull two figures from each: capital expenditure (capex, the money spent on new physical assets) and the depreciation charge (the accounting cost of existing assets wearing out). Add each across the industry, then divide capex by depreciation.
- Below 1 — the industry is shrinking. Assets are not being replaced as they wear out.
- Around 1 — steady state. Maintaining, not expanding.
- Above 1.5 — expanding. New capacity is coming in two to four years.
Depreciation is roughly what it costs to stand still, so this ratio is a supply forecast hiding in plain sight. An industry spending well below depreciation for several years is quietly consuming its own capacity — the condition that eventually produces high prices. And it happens while sentiment is at its worst and the shares look expensive, because profits are at their lowest. An industry spending far above depreciation while reporting record margins is building the thing that will end the record margins — while the shares look cheap on current profits.
Now run the mechanism yourself:
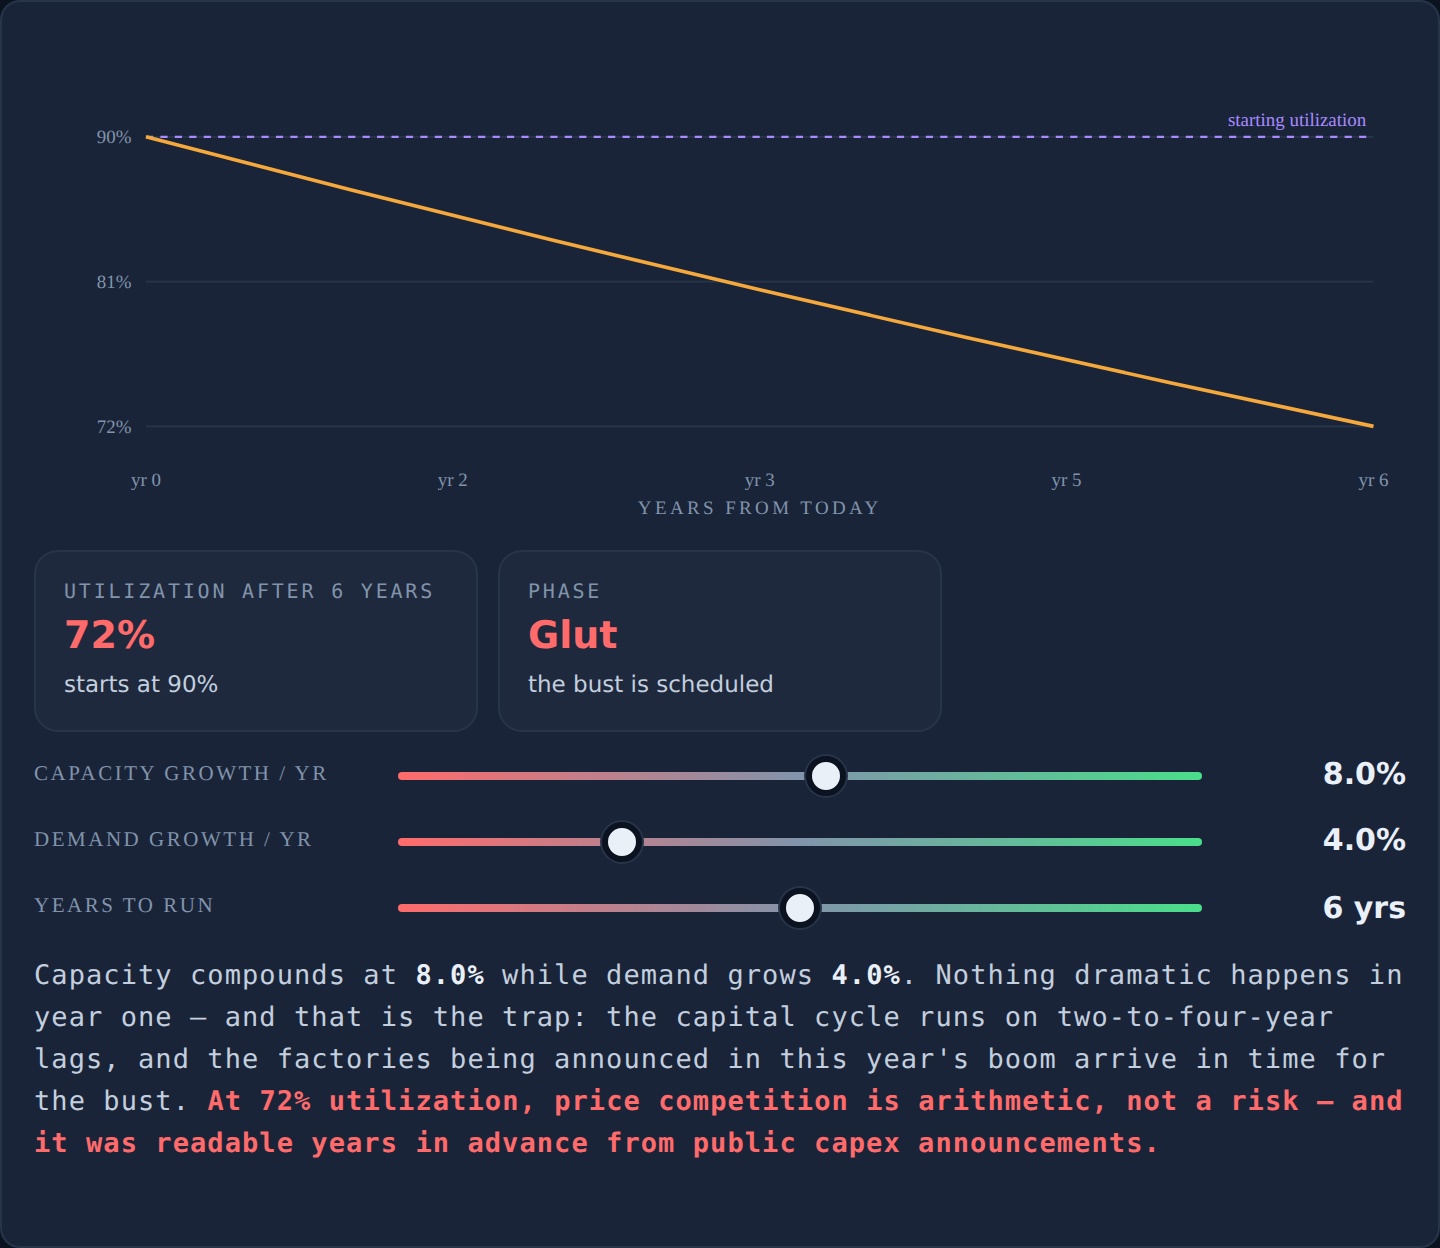
The lab has three sliders: industry capacity growth (% per year), demand growth (% per year), and years to run (2 to 10). It reads out utilization at the end of the run and a phase verdict — tightening, balanced, or glut — and charts the utilization path over the years. Set capacity growth a couple of points above demand growth and give it six years: watch utilization slide and the verdict flip to glut. Then invert it — demand growing 4%, capacity growing 1% — and see how quickly a market tightens when nobody is building. Small, persistent gaps between the two growth rates decide everything; that is why the capex-to-depreciation ratio matters more than any single year's demand forecast.
Both sides of the cycle: when cheap is dangerous and expensive is safe
The Ledger reads every signal from both sides, and the capital cycle is where the habit pays most.
The buying end. Industry capex below depreciation for years. Capacity shrinking. Weak competitors exiting or merging. Everyone earning less than their cost of capital and refusing to expand. Pessimism universal. This is where multi-year gains are created — and the valuation ratios look expensive, because profits sit at their lowest point.
The selling end. Record margins, record capital spending, new entrants, expansion announcements stacking up, "this time demand is structural" on every earnings call, and companies issuing shares to fund construction. Profits peak at roughly the moment the new capacity starts producing — so the ratios look cheap at the exact top.
This is why a low P/E on a cyclical is not a bargain signal by itself. A grade from the Fundamentals Grader or a screen built on the Ratio Bench tells you how a company scores on today's numbers; the capital cycle tells you whether today's numbers are a peak or a trough.
Sector-specific KPIs: the numbers that move the multiple
Every industry has three or four figures that genuinely drive its valuations and dozens that do not. A retailer's like-for-like sales matter more than its P/E. A bank's capital ratio matters more than its price to book. A miner's cash cost per ounce matters more than its dividend yield. These numbers rarely sit in the financial statements — look in the business review and the results presentation. The module's interactive sector finder lists them for twelve industries, and the glossary defines the odd ones, from combined ratio to AISC.
Sector rotation and interest rates
Industries also respond differently to the economy. Early in a recovery, consumer discretionary, banks and industrials tend to lead; late in an expansion, energy and materials; in a contraction, food, household goods, healthcare and utilities hold up best. Interest rates act mechanically: rising rates hit hardest the companies whose profits sit far in the future, widen banks' lending margins, and squeeze property companies whose borrowing costs rise against contract-fixed rents.
Use this to decide how much to commit and which side of a comparison to take — not whether an individual company is mispriced. A well-researched bearish case in an industry attracting large inflows will still lose money for a while.
Structure first, then selection
A great company in an industry building too much capacity will still disappoint. An average company in an industry where capacity is shrinking can do very well. Establish the structure and the cycle's position first; only then pick companies within it.
This article is the companion to module 15 of 17 in The Ledger — free, no signup, with drills and quizzes throughout. It builds directly on how to research a single company, and the series finishes with turning research into a decision you can defend.
Take the full lesson: The industry sets the ceiling
Frequently asked questions
What is capital cycle investing?
Capital cycle investing is analyzing an industry by following its money rather than its demand forecasts. When an industry earns unusually high returns, capital floods in and builds new capacity; when that capacity arrives, supply exceeds demand and returns collapse; capital then exits until scarcity restores pricing. Investors who read the supply side — capex plans, equipment orders, permits — can see the turn coming years early, because expansion is announced publicly long before it produces anything.
How do you use Porter's five forces to analyze a stock?
Ask five plain questions about the industry: how concentrated are the top four players and is that share growing; could a well-funded entrant replicate the business with money alone; does any supplier hold a chokepoint; do a few large customers dictate prices; and what could replace the product, including doing nothing. Industries that fail several of these grind every participant down to its cost of capital, however well managed.
What does the capex to depreciation ratio tell you?
Depreciation is roughly the annual cost of standing still, so capex divided by depreciation measures whether an industry is expanding or shrinking its asset base. A ratio around 1 means maintenance only. Above 1.5 means significant new capacity is coming in two to four years. Below 1 for several years means capacity is being consumed without replacement — the condition that eventually tightens supply and lifts prices.
Why do cyclical stocks look cheap at the top of the cycle?
Because valuation ratios divide price by current profits, and a cyclical's profits peak at exactly the moment new industry capacity starts producing. Peak earnings make the P/E look low right before margins collapse. The mirror image holds at the bottom: trough earnings make the shares look expensive at precisely the point supply has stopped growing and the recovery is being set up.
What are sector-specific KPIs and why do they matter?
Every industry has three or four measures that genuinely drive its valuations and dozens that do not. A retailer's like-for-like sales matter more than its P/E; a bank's capital ratio matters more than its price to book. These figures usually sit in the business review or results presentation rather than the financial statements, and none of them appear in a generic ratio screen.
What is sector rotation in the economic cycle?
Different industries lead at different stages of the economy. Early in a recovery, consumer discretionary, banks and industrials tend to do best; late in an expansion, energy and materials; in a contraction, food, household goods, healthcare and utilities hold up best. Use this to size positions and choose which side of a comparison to take, not to decide whether an individual company is mispriced.
How do rising interest rates affect different sectors?
Mechanically. Companies whose profits sit far in the future are hit hardest, because distant profits are discounted more heavily when rates rise. Banks usually benefit, because the margin between lending and deposit rates widens. Property companies suffer, because borrowing costs rise against rents fixed by contract. A company with floating-rate debt and far-off profits is hit twice by the same move.
How long does a capital cycle take to play out?
In industries that own physical assets, the build phase alone takes two to four years — the time between announcing a factory, ship or fab and it producing anything. That lag is why the downturn surprises people: everyone reacted to the same high prices at the same time, so the new capacity arrives roughly together. Full cycles from peak to peak commonly span five to ten years.