Capital Structure Explained — Leverage, WACC & Both Sides
Short answer: Capital structure is the mix of debt and equity funding a business, and it changes what the shares are worth and how they behave. Borrowing magnifies shareholder returns in both directions: the same $100m operating profit returns 10% to an all-equity owner but 14% to one funded half by 6% debt — and when profit falls a third, the levered return nearly halves while the unlevered one falls in proportion. The blended price of that funding is the weighted average cost of capital (WACC), the hurdle every reinvested dollar must clear.
The same business funded two different ways is two different investments. That is the whole subject of capital structure — the mix of debt and equity paying for a company's operations — and it decides how much the shares are worth, how violently they move, and who gets wiped out when a bad year arrives.
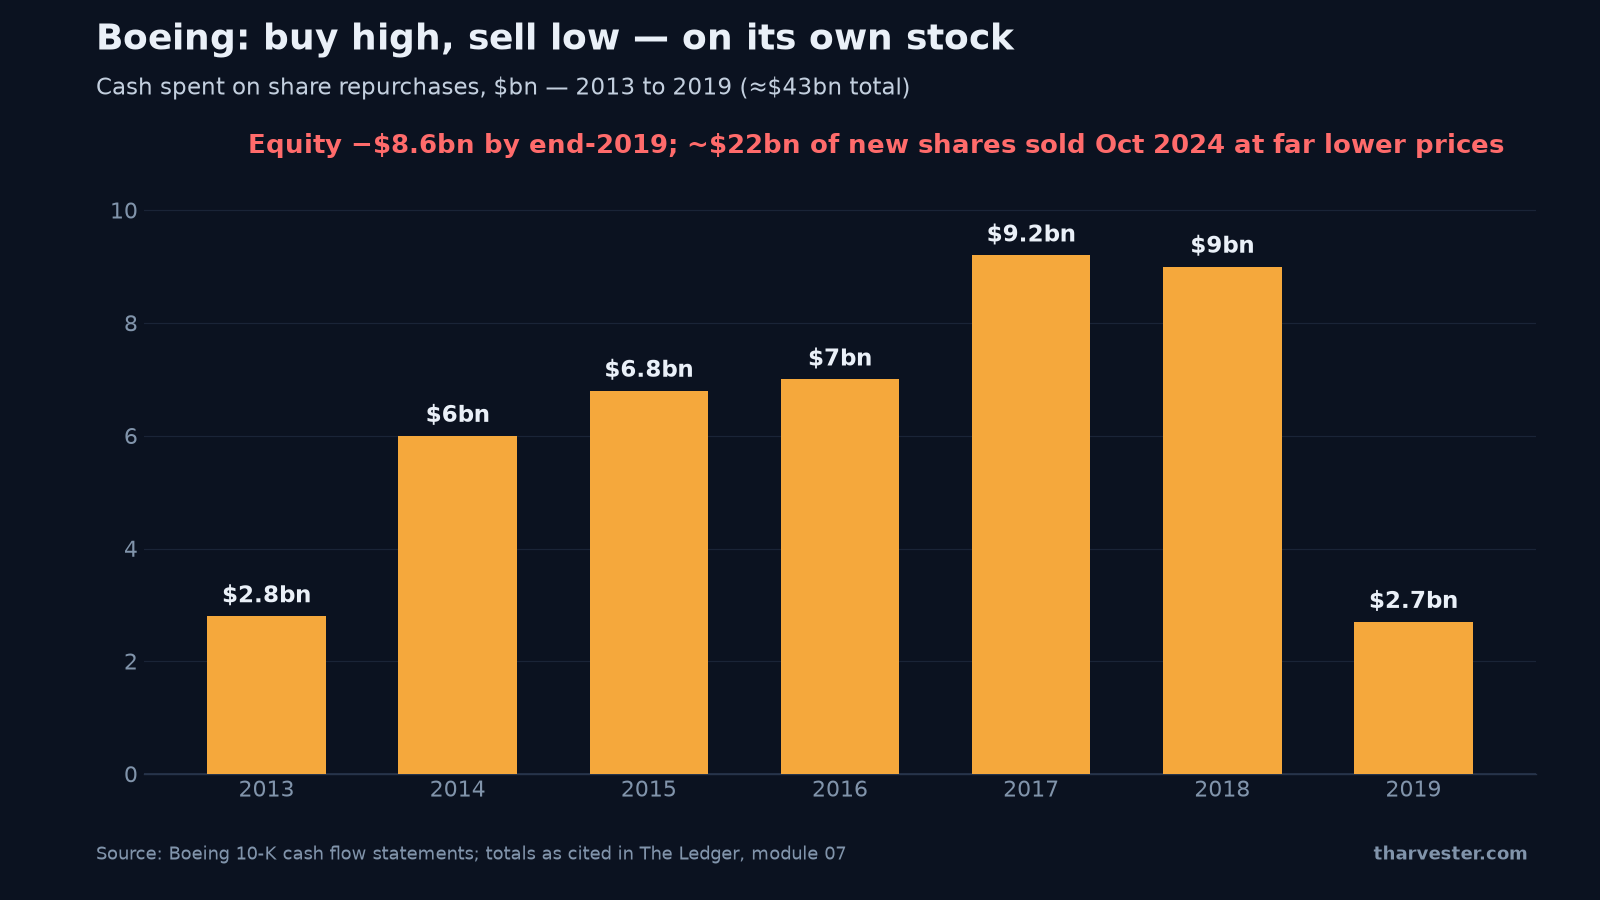
The chart above shows how it ends when the mix is managed badly. It plots Boeing's spending on its own shares by year: roughly $43bn of buybacks between 2013 and 2019, heaviest near the price highs. Boeing ended 2019 with shareholders' equity of −$8.6bn, then sold about $22bn of new shares in October 2024 at far lower prices — every step disclosed before the outcome was obvious. This article works through the machinery behind that chart, the way The Ledger does: from both sides.
Capital structure explained: debt, equity, and the hybrids between
Every company is funded from two sources. Equity is money from shareholders. It is never repaid, it ranks last, and in exchange its owners keep everything left over. Debt is money from lenders. It must be repaid on fixed dates with interest, whether the year went well or badly, and it ranks first — but lenders are owed a fixed amount, no more, however well the business does.
Between them sit hybrids worth hunting for in the notes: preferred stock, which ranks ahead of common shares for dividends and in a wind-up, and convertible bonds, which start as debt and turn into shares if the price rises enough. Both take value from common shareholders in ways that are easy to overlook.
The previous article in this series asked whether a company survives its debt. This one asks how the funding mix changes what the shares are worth even when survival is not in doubt.
How leverage affects shareholder returns — worked both ways
Leverage means using borrowed money to increase returns. The mechanism fits in a sentence: interest is a fixed cost, so once it is covered, everything above it belongs to a smaller group of owners.
Take the module's worked figures. A business worth $1,000m earns $100m of operating profit. Company A is all-equity; Company B is $500m of equity plus $500m of debt at 6% interest (ignore tax to keep the arithmetic visible).
- Company A: $100m ÷ $1,000m = 10% return on equity.
- Company B: interest is $500m × 6% = $30m, leaving $70m for shareholders. $70m ÷ $500m = 14%.
Same operations, same profit — four extra points of return, created purely by borrowing at 6% against assets earning 10%. This is why leverage is used, and why return on equity alone is a poor measure of business quality.
Now run it downhill. Operating profit falls by a third, to $67m. Company A's shareholders earn 67 ÷ 1,000 = 6.7% — down by a third, in proportion. Company B still owes its $30m of interest, so shareholders get $37m: 37 ÷ 500 = 7.4% — down by nearly half. Push profit to $30m and Company A's owners still earn 3% while Company B's earn nothing at all.
Leverage does not create value. It redistributes an unchanged result into a smaller pot, making good years better and bad years far worse. The business has not become riskier — the investment has.
Try the mechanism yourself. This is the capital structure bench from the course:
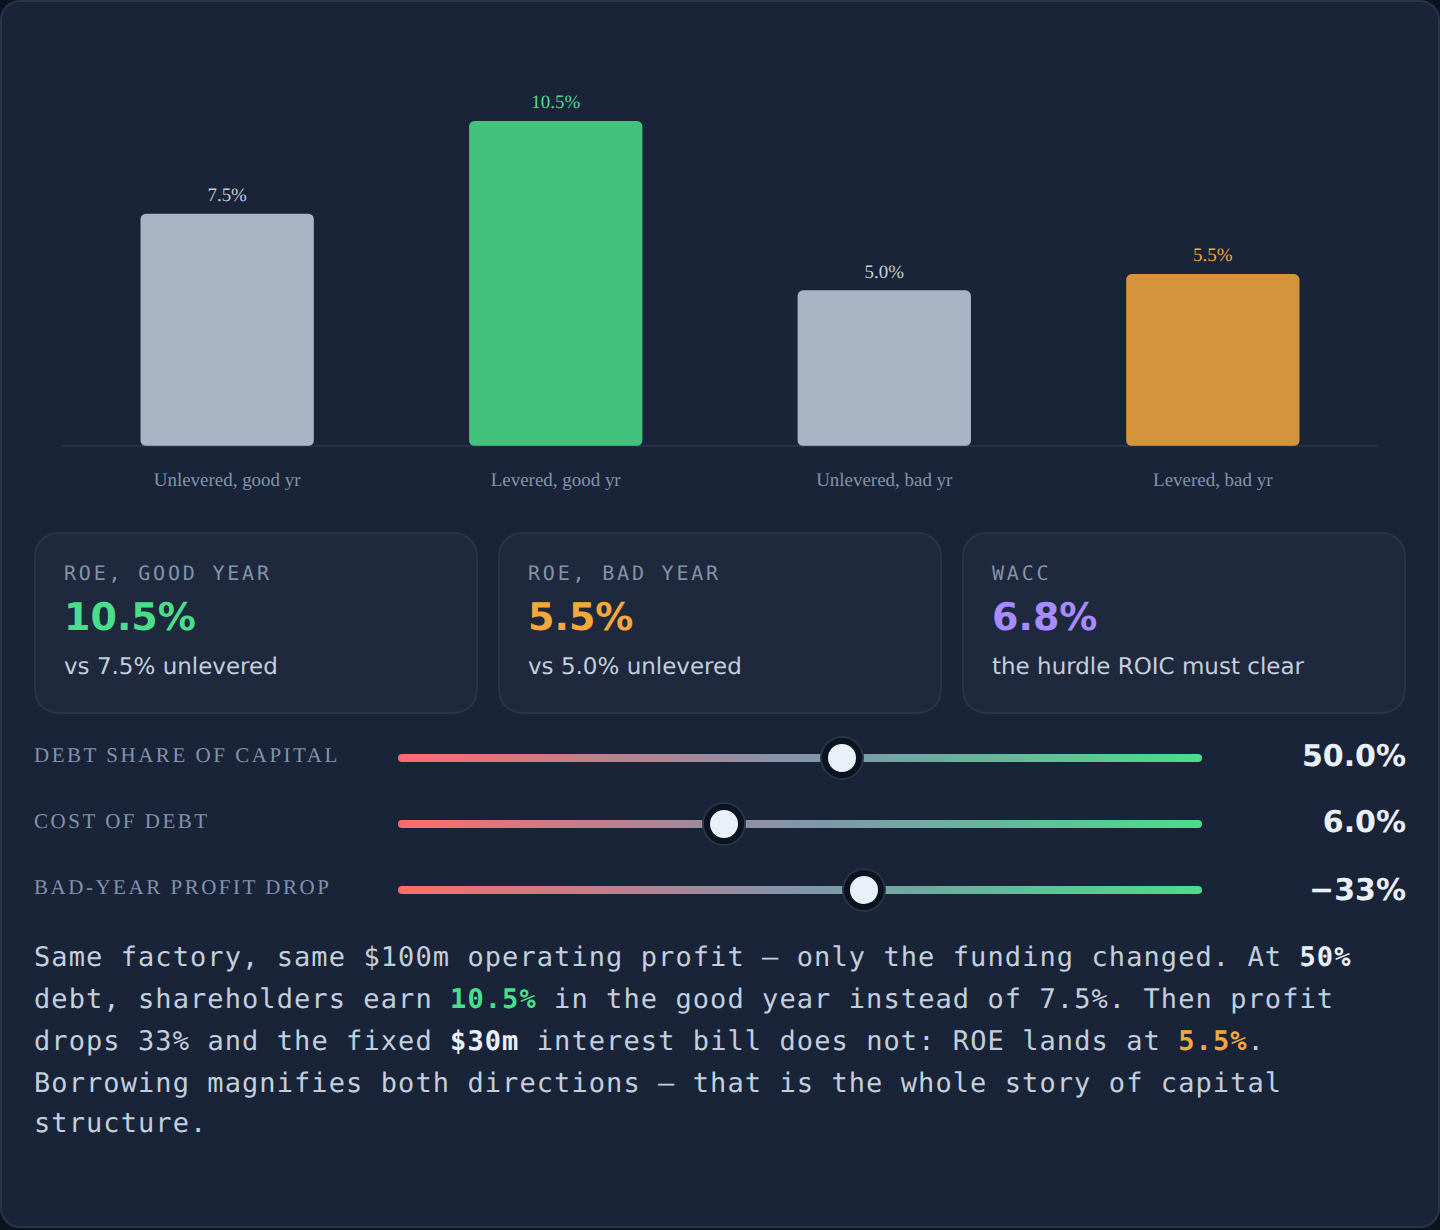
Drag the debt share of total capital up from 0% toward 90% and watch the two return-on-equity readouts split apart: in the good year the levered return climbs above the unlevered one; in the bad year it falls further below. Widen the profit swing and the bad-year levered return collapses first — the interest bill is fixed, so the whole shortfall lands on a shrinking slice of equity. Nudge the cost of debt up and the WACC readout rises with it; once borrowing costs approach what the assets earn, leverage stops paying shareholders anything for the extra risk.
When debt is large, shares become a bet on survival
When debt is big relative to the business, the shares stop behaving like ownership. On a business worth $10bn funded by $2bn of equity and $8bn of net debt, a 20% fall in the value of the business wipes shareholders out entirely — the lenders are still owed the full $8bn. Run it the other way: if the business becomes worth $12bn, equity goes from $2bn to $4bn. A 20% gain in the business became a 100% gain on the shares. Cheap-looking shares in heavily indebted companies are therefore not value investments in the ordinary sense — they are high-risk, high-reward positions whose range of outcomes includes zero, and they should be sized accordingly.
WACC calculation example — the hurdle every dollar must clear
Every dollar funding a business has a price. Debt's price is visible: the interest rate, reduced by tax relief, since interest is deducted before tax. Equity's price is invisible but real: the return shareholders require for standing last in the queue — always higher than the cost of debt, because the risk is greater. Blend the two in proportion and you get the weighted average cost of capital, or WACC.
The module's example: a company 70% equity, 30% debt. Shareholders require 9%; debt costs 5% before tax; the tax rate is 25%.
- After-tax cost of debt: 5% × (1 − 0.25) = 3.75%
- Equity contribution: 0.70 × 9% = 6.30%
- Debt contribution: 0.30 × 3.75% = 1.13%
- WACC ≈ 7.4%
This company must earn more than 7.4% on the money invested in it to be worth anything to its owners. That is the hurdle ROIC has to beat, and the discount rate a reverse DCF depends on — move it one point and the growth a share price implies changes substantially. Earning 12.9% against a 7.4% cost of capital creates value with every reinvested dollar; earning 5% destroys value while reporting a healthy-looking profit.
Debt vs equity financing: the trade-off with a middle
Does the mix change what the business is worth? In theory — no taxes, no risk of failure — it would not. In the real world two effects pull in opposite directions. Tax favors debt: interest is deducted before tax, dividends are not. Failure costs money: as borrowing rises, so does the chance of financial distress, and distress is expensive well before bankruptcy — suppliers demand payment up front, good staff leave, assets get sold at bad prices.
The result is a trade-off with a middle, and the right amount depends on the business. Regulated utilities and long-let property can carry a lot, because revenue is contractual. Consumer staples and established software carry a moderate amount. Airlines, carmakers and miners should carry little — revenue can halve in a recession while interest does not. Loss-makers should carry almost none. Banks and insurers play by different rules: borrowing is their raw material, so use regulatory capital ratios instead.
Reading capital structure from both sides
The long reading. A company paying debt down transfers value to shareholders every year without the business improving. If the enterprise stays worth $10bn while net debt falls from $6bn to $4bn, the equity has gone from $4bn to $6bn — a 50% gain from repayment alone. Companies emerging from a bad period with too much debt and a recovering business are among the highest-returning shares that exist.
The short reading. The same mechanism runs in reverse. When net debt is rising, interest cover is falling, and a large repayment is approaching — all three together — the company will eventually choose between selling assets cheaply and selling shares cheaply, and both outcomes land on existing shareholders. The forced-dilution test makes it concrete: cash plus undrawn facilities, minus everything due in eighteen months, compared against the market cap. A gap above roughly a quarter of the market value makes a heavily dilutive issue a plan, not a risk.
Judging management: the five uses of cash
Capital allocation is what management does with the money the business generates, and there are only five options: reinvest, acquire, pay dividends, buy back shares, repay debt. Reinvestment is correct when ROIC comfortably beats WACC. Buybacks create value only when shares are bought below what they are worth — judge the timing, not the size.
That brings the Boeing chart full circle. Roughly $43bn of repurchases between 2013 and 2019, heaviest near the highs; equity of −$8.6bn by the end of 2019; about $22bn of new shares sold in October 2024 at far lower prices. Buy high, sell low, on the company's own stock — and a team that behaves that way in one cycle will repeat it in the next. Plot any company's share count against its share price over ten years and you have run the cleanest management test available. The Fundamentals Grader checks the share-count trend for you, and the Ratio Bench computes the leverage metrics beside it.
Keep going
The full lesson — Capital structure and what it does to an investment — adds the maturity-schedule checklist, the tax-shield drill, and the forced-dilution test worked on a real filing. It is module 07 of The Ledger, free with no signup. Next in this series: the balance sheet's other lever — DSO, DIO, DPO and the cash conversion cycle, where trouble shows up quarters before the profit line. Terms along the way live in the glossary.
Work through capital structure in module 07 — and never read a return on equity at face value again.
Frequently asked questions
What is capital structure in simple terms?
Capital structure is the mix of the two kinds of money funding a company. Equity comes from shareholders, is never repaid, and ranks last in the queue — in exchange, shareholders own everything left over. Debt comes from lenders, must be repaid on fixed dates with interest whether the year went well or badly, and ranks first. Two companies running identical operations can be completely different investments purely because of that mix.
How does leverage affect shareholder returns?
Interest is a fixed cost, so once it is covered, everything above it belongs to a smaller group of owners. A business earning $100m on $1,000m of capital returns 10% funded all by equity; funded half by debt at 6%, the same profit becomes $70m after $30m of interest on a $500m equity base — 14%. But cut operating profit by a third to $67m and the levered return falls to 7.4%, nearly half, because the $30m interest bill does not fall with profits.
How do you calculate the weighted average cost of capital (WACC)?
Weight the cost of each funding source by its share of the total. A company 70% equity and 30% debt, where shareholders require 9%, debt costs 5% before tax, and the tax rate is 25%: after-tax cost of debt is 5% × (1 − 0.25) = 3.75%, so WACC = (0.70 × 9%) + (0.30 × 3.75%) = 6.30% + 1.13% ≈ 7.4%. The company must earn more than 7.4% on the money invested in it to create value for its owners.
Is debt cheaper than equity financing?
Usually, for two reasons. Lenders take less risk — they are paid first and owed a fixed amount — so they charge less than the return shareholders require. And interest is deducted before tax while dividends are not, so each dollar of interest costs the company less than its headline rate. The catch is that the costs of too much debt arrive suddenly and mostly at the worst time, as financial distress: suppliers demanding payment up front, staff leaving, assets sold at bad prices.
Why is return on equity a poor measure of business quality?
Because leverage inflates it without the business improving. In the worked example above, Company B reports a 14% return on equity against Company A's 10% from identical operations — the extra four points come entirely from borrowing at 6% against assets earning 10%. A high ROE can describe a great business, or an ordinary business carrying a lot of debt. Return on invested capital, compared against the cost of capital, separates the two.
What is the forced-dilution test?
Take the company's cash plus undrawn credit facilities, subtract everything due in the next eighteen months — debt maturities plus cash burn if it is losing money — and compare any shortfall with the market value of the equity. If the gap is a large fraction of the market cap, a heavily dilutive share issue is not a risk; it is a plan waiting to be announced, and the cost of the rescue falls on existing shareholders.
When do share buybacks create value for shareholders?
Only when shares are bought below what they are worth — so judge management by when they bought, not how much. The cleanest test is to plot the share count against the share price over ten years. Boeing repurchased roughly $43bn of its own shares between 2013 and 2019, ended 2019 with shareholders' equity of −$8.6bn, then sold about $22bn of new shares in October 2024 at far lower prices — value destroyed on both sides of the trade.
Does capital structure change what a business is worth?
In a theoretical world with no taxes and no risk of failure, no — the same operating profit is just divided differently between lenders and shareholders. In the real world, two effects pull opposite ways: tax favors debt because interest is deductible, while the risk of financial distress grows with borrowing and is expensive well before bankruptcy. The result is a trade-off with a middle: some debt is usually cheaper than none, and too much costs far more than it appears.