Cash Conversion Cycle Explained — DSO, DIO & DPO in Days
Short answer: The cash conversion cycle is DSO + DIO − DPO: the number of days between paying for materials and being paid for the finished product, and every one of those days is funded from the company's own pocket. A manufacturer with DSO 55, DIO 66 and DPO 51 runs a 70-day cycle — roughly $1.2bn tied up on $6.2bn of revenue. A negative cycle, as supermarkets and subscription businesses run, means growth generates cash instead of consuming it. Deterioration in DSO or DIO typically shows up two to four quarters before trouble reaches reported profit.
Working capital is the money tied up in the day-to-day running of a business: stock in warehouses, invoices customers have not yet paid, minus the invoices the company has not yet paid its suppliers. It is the earliest place trouble shows up — usually two to four quarters before the profits move.
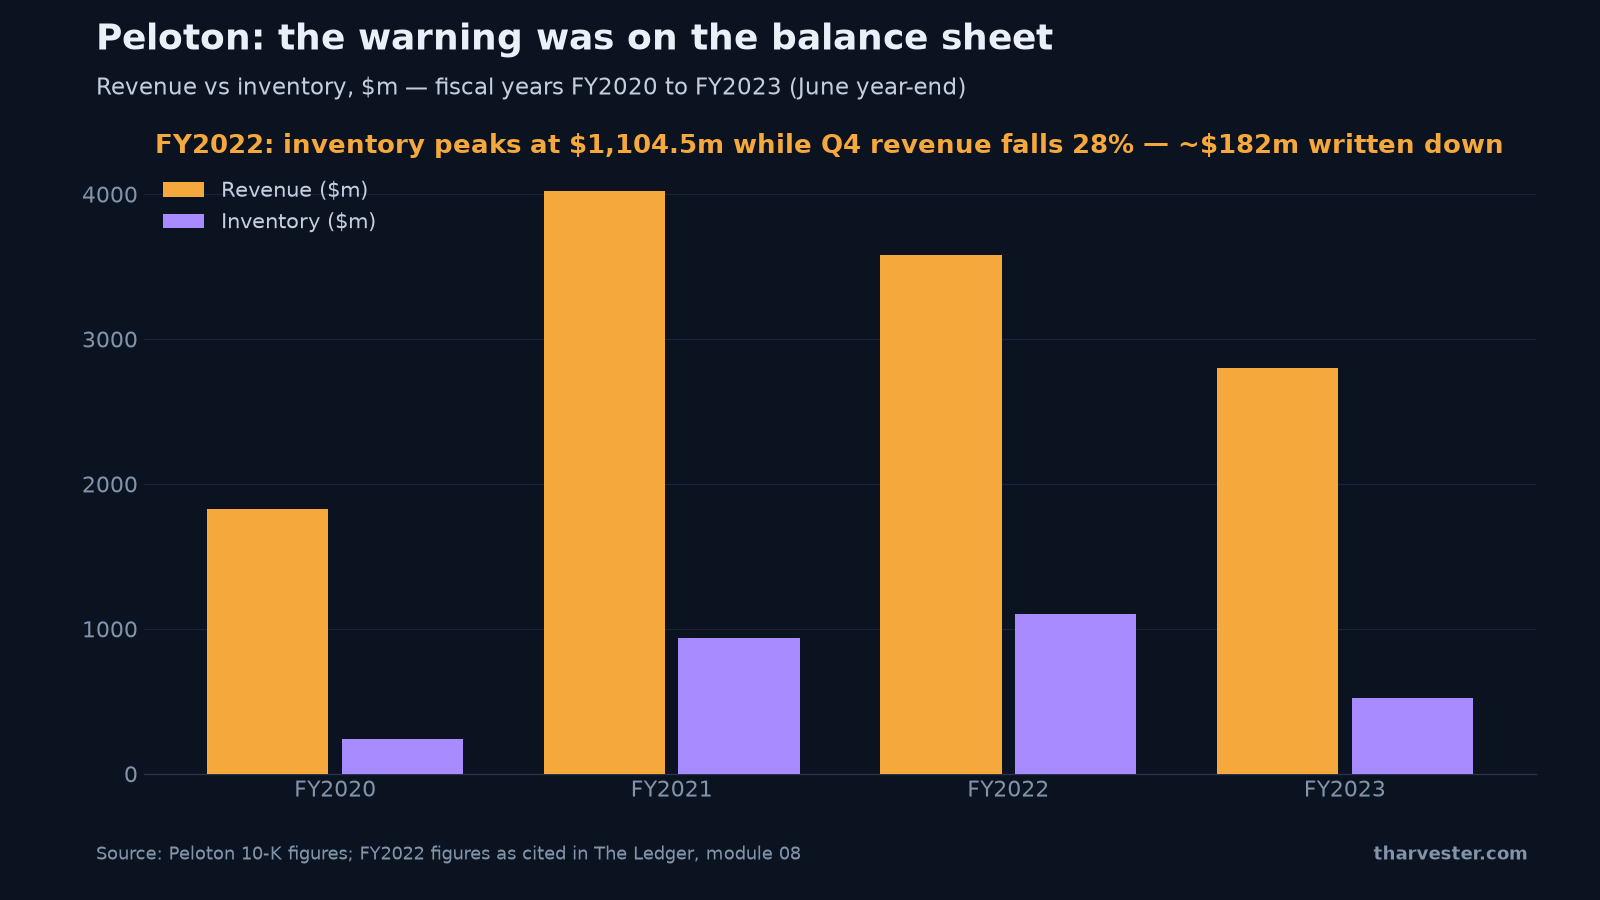
The chart above is that early warning in one picture. It plots Peloton's revenue against its inventory by fiscal year: sales surged through the pandemic, then rolled over in FY2022 — while inventory kept climbing to a peak of $1,104.5m. Stock rising while sales fall is a loss that has not been admitted yet, and anyone comparing the two lines saw it quarters before the income statement did. This article covers the three day-counts behind that chart, the cash conversion cycle they add up to, and — in the style of The Ledger — the long reading and the short reading of each.
What is the cash conversion cycle? DSO, DIO and DPO defined
Each of the three day-counts converts a balance-sheet figure into days, which makes companies of different sizes comparable — and makes drift visible across years.
- Days sales outstanding (DSO) = (receivables ÷ revenue) × 365. How long customers take to pay.
- Days inventory outstanding (DIO) = (inventory ÷ cost of goods sold) × 365. How long stock sits before it is sold.
- Days payable outstanding (DPO) = (payables ÷ cost of goods sold) × 365. How long the company takes to pay its own suppliers.
Put them together:
Cash conversion cycle = DSO + DIO − DPO
That is the number of days between paying for materials and being paid for the finished product. Every one of those days is a day the company funds from its own pocket.
A worked example: 70 days and $1.2bn of trapped cash
Take the module's manufacturer: revenue $6,200m, cost of goods sold $4,402m, receivables $940m, inventory $790m, payables $610m.
- DSO = (940 ÷ 6,200) × 365 = 55 days
- DIO = (790 ÷ 4,402) × 365 = 66 days
- DPO = (610 ÷ 4,402) × 365 = 51 days
- Cash conversion cycle = 55 + 66 − 51 = 70 days
At $6,200m of annual revenue, roughly $1.2bn is tied up funding that 70-day gap at any moment ($6,200m ÷ 365 × 70). And here is the part growth investors skip: if this business grows 20%, it needs about $240m more cash just to stand still — before buying a single new machine. That is why fast-growing companies with long cycles keep needing money, and why a growth rate on its own never tells you whether growth is affordable.
Now run the machine yourself. This is the working-capital bench from the course:
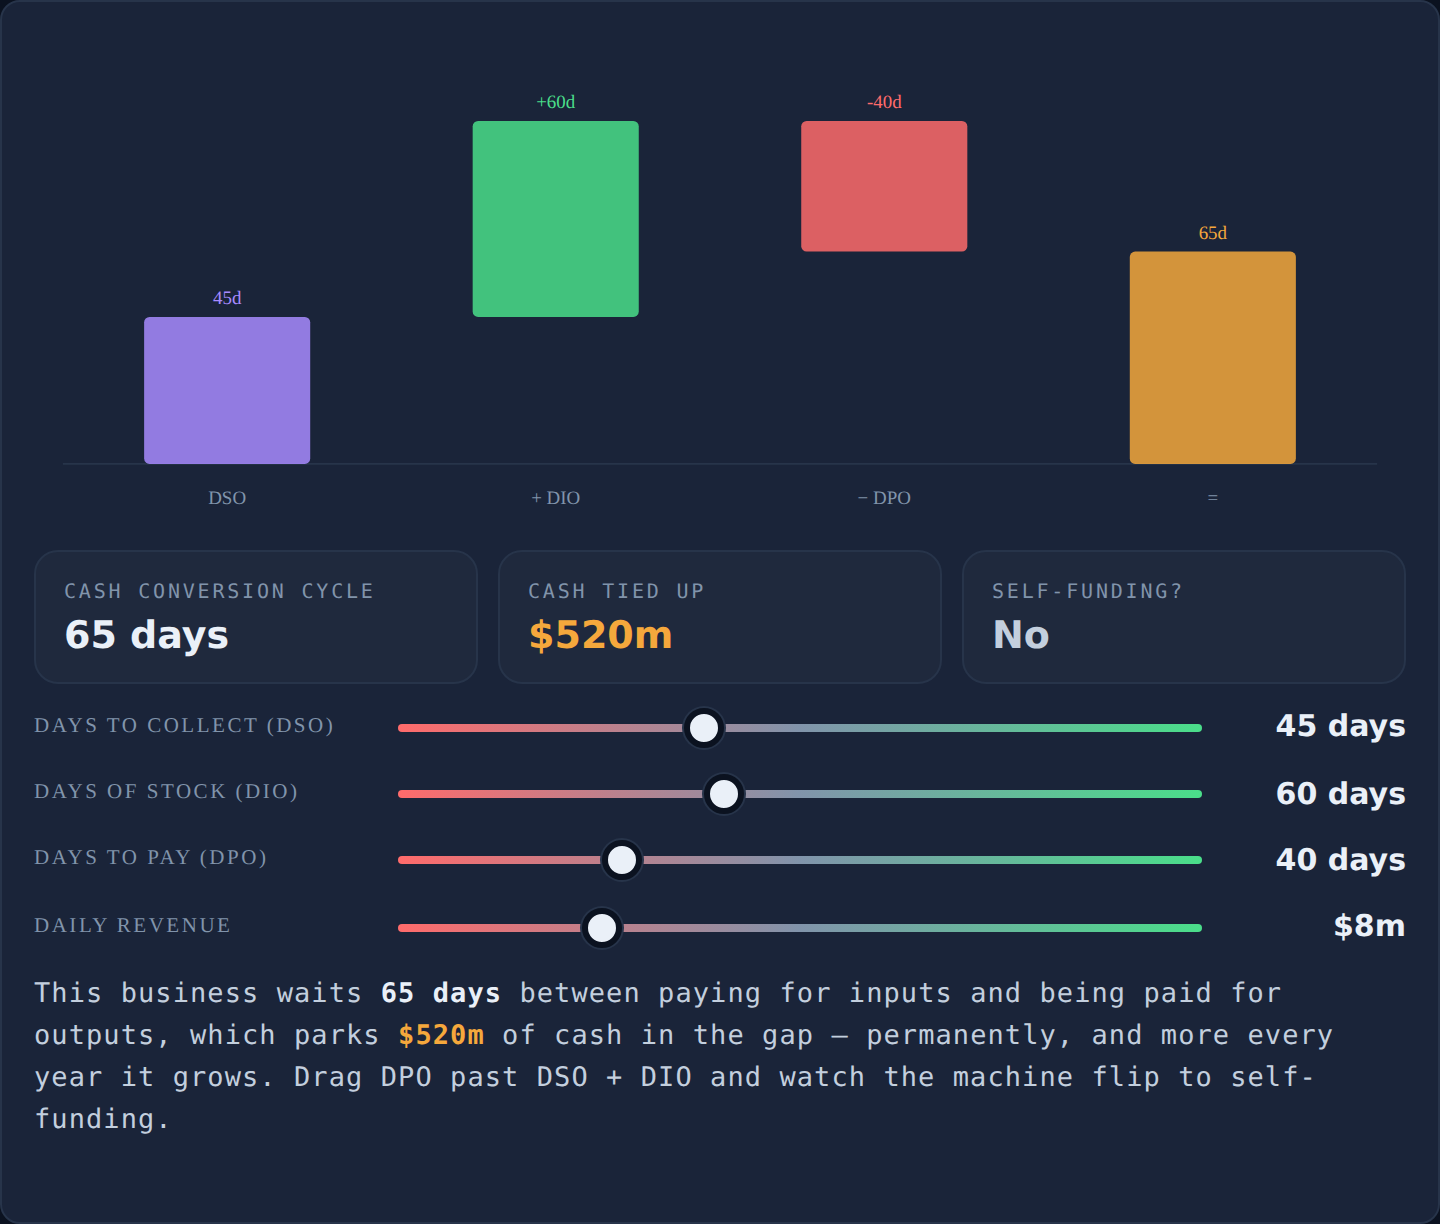
Drag DSO or DIO up and watch two readouts move together: the cycle lengthens, and the cash tied up grows in proportion to the daily revenue you set. Then stretch DPO — the supplier-financing lever — and watch the cycle shrink until it crosses zero, where the cash readout flips from tied up to released and the self-funding badge appears. That badge is the exact structural feature the next section is about.
Negative working capital: when growth pays for itself
Some businesses run a negative cash conversion cycle: they collect from customers before they pay suppliers. Supermarkets sell a tin of beans in days but pay the supplier in weeks. Subscription businesses charge a year up front and deliver the service over the following twelve months. Work the quiz example: DSO 40 + DIO 30 − DPO 90 = −20 days.
For those companies, growth funds itself. Every new customer hands over cash before any cost is paid, so expansion produces money rather than consuming it — no borrowing, no share issues. That structural feature justifies a genuinely higher valuation and is one of the most durable advantages a business can have. It is the long-side reading of this whole module: a durable negative cycle is a reason a quality business deserves its premium multiple.
Two more efficiency measures round out the toolkit. Asset turnover = revenue ÷ total assets: $6,200m of revenue on $6,900m of assets is 0.90 — every dollar of assets generates 90 cents of sales a year. Inventory turnover = cost of goods sold ÷ average inventory: how many times a year the stock is sold and replaced. Rising is good; falling means stock is piling up.
Peloton FY2022: inventory as the early warning
Peloton is the clearest recent illustration of why the short side watches these lines. Demand surged during pandemic lockdowns, the company built and bought stock to meet it, and then demand reversed faster than the supply chain could. From the module, fiscal 2022:
- Inventory peak: $1,104.5m — it later fell 81% by FY2025
- Q4 FY2022 revenue: $678.7m — down 28% year on year
- Inventory write-down: ~$182m in Q3, with reserves around $255m by September 2022
- FY2022 operating margin: −76.3% — a loss of $2,734m on $3,582m of revenue
The sequence matters more than any single figure. Stock rose while sales fell. Because inventory is carried at cost, nothing appeared in the profit line at first — the damage sat quietly on the balance sheet as an asset. The loss only reached the income statement when the company admitted the goods would not sell at full price. The chart at the top of this page is exactly the comparison that caught it: inventory growth against revenue growth, quarter by quarter.
How to track DSO, DIO and DPO — the short side's calendar
The method is mechanical. Pull receivables, inventory, payables, revenue and cost of goods sold from the last eight quarterly filings and compute the day-counts for each quarter. Then compare every quarter with the same quarter a year earlier — never the quarter just gone, because most businesses are seasonal and sequential comparisons produce false alarms.
A steady climb in DSO or DIO over two or more years is the signal. Deterioration typically arrives two to four quarters before the trouble reaches reported profit — precisely the window in which a short can be established at a good price, or a long can be trimmed calmly instead of sold in a panic. The Ratio Bench computes all four working-capital metrics from raw filing figures, and the Fundamentals Grader flags receivables and inventory outgrowing revenue automatically.
Working capital also connects backward and forward in the course. Cash trapped in the cycle is one of the levers inside cash from operations covered in free cash flow quality, and the previous article in this series — capital structure — explains who has to fund the gap when the cycle lengthens: lenders or shareholders.
Keep going
The full lesson — Working capital: how fast the business turns effort into cash — adds the negative-cycle drill, the eight-quarter DSO exercise, and the Peloton test you can run on any company that sells physical products. It is module 08 of The Ledger, free with no signup. Next in this series: revenue growth quality — organic vs acquired, price vs volume, because once you know growth is affordable, the next question is whether it is real. Terms along the way live in the glossary.
Learn the cash conversion cycle in module 08 — and catch the write-down before the income statement does.
Frequently asked questions
How do you calculate the cash conversion cycle?
Cash conversion cycle = DSO + DIO − DPO. Days sales outstanding is (receivables ÷ revenue) × 365; days inventory outstanding is (inventory ÷ cost of goods sold) × 365; days payable outstanding is (payables ÷ cost of goods sold) × 365. A company with DSO of 55, DIO of 66 and DPO of 51 waits 55 + 66 − 51 = 70 days between paying for materials and collecting from customers.
What is a good cash conversion cycle?
It depends entirely on the industry — anywhere from negative to over 150 days can be normal. What matters more than the level is the direction: a cycle lengthening year over year means cash is being absorbed by operations. Best of all is a negative cycle, where customers pay before suppliers are paid, because then growth produces cash instead of consuming it.
What does days sales outstanding (DSO) tell you?
DSO is (receivables ÷ revenue) × 365 — how long, on average, customers take to pay. A steady climb over two or more years means the company is either extending easier terms to keep sales moving or struggling to collect, and both stories tend to reach the income statement later. Always compare a quarter with the same quarter a year earlier, because most businesses are seasonal.
What is a negative working capital business?
One that collects from customers before it pays its suppliers, so its cash conversion cycle is below zero. Supermarkets sell a tin of beans in days but pay the supplier in weeks; subscription software charges a year up front and delivers over twelve months. For these businesses every new customer hands over cash before any cost is paid — expansion funds itself, which justifies a genuinely higher valuation multiple.
Why does rising inventory predict falling profits?
Because inventory is carried on the balance sheet at cost, unsold stock does no damage to reported profit at first — it sits quietly as an asset. The loss only reaches the income statement when the company admits the goods will not sell at full price and writes them down. Peloton's FY2022 is the textbook case: inventory peaked at $1,104.5m while Q4 revenue fell 28% year on year to $678.7m, and roughly $182m was written down.
How much cash does the cash conversion cycle tie up?
Roughly annual revenue divided by 365, multiplied by the cycle in days. A company with $6,200m of revenue and a 70-day cycle has about $1.2bn permanently funding the gap between paying for inputs and being paid for outputs. If that business grows 20%, it needs roughly $240m more working capital just to stand still — before buying a single new machine.
What is inventory turnover and what does a falling number mean?
Inventory turnover is cost of goods sold divided by average inventory — how many times a year the stock is sold and replaced. Rising is good. Falling means stock is piling up relative to sales, which is either a deliberate build ahead of demand or, more often, demand arriving below plan. Compare inventory growth with revenue growth: inventory growing faster for more than a quarter or two is a write-down forming.
How early does working capital warn of earnings trouble?
Typically two to four quarters before the problem reaches reported profit, in most industries. Track DSO, DIO and DPO quarter by quarter from the 10-Q filings, comparing each quarter with the same quarter a year earlier to strip out seasonality. That lead time is the entire practical value of watching working capital — it is the window in which a decision can still be made calmly.