Earnings Quality Red Flags — The Forensic Checklist
Short answer: Earnings quality means how closely reported profit matches cash reality. The fastest screen is the accrual ratio: net profit minus cash from operations, divided by average total assets — negative is comfortable, positive and rising means a growing share of profit exists only on paper. The Beneish M-score adds an eight-variable manipulation screen. Both are smoke detectors: two or three red flags is ordinary corporate life, but several clustered in one area — as at Wirecard, where €1.9bn of claimed cash turned out not to exist — is a reason to keep digging.
Earnings quality means how closely reported profit matches economic reality. High-quality profit turns into cash, repeats next year, and does not depend on optimistic assumptions. Low-quality profit exists mainly because of a judgment someone made about when to record a sale or where to put a cost.
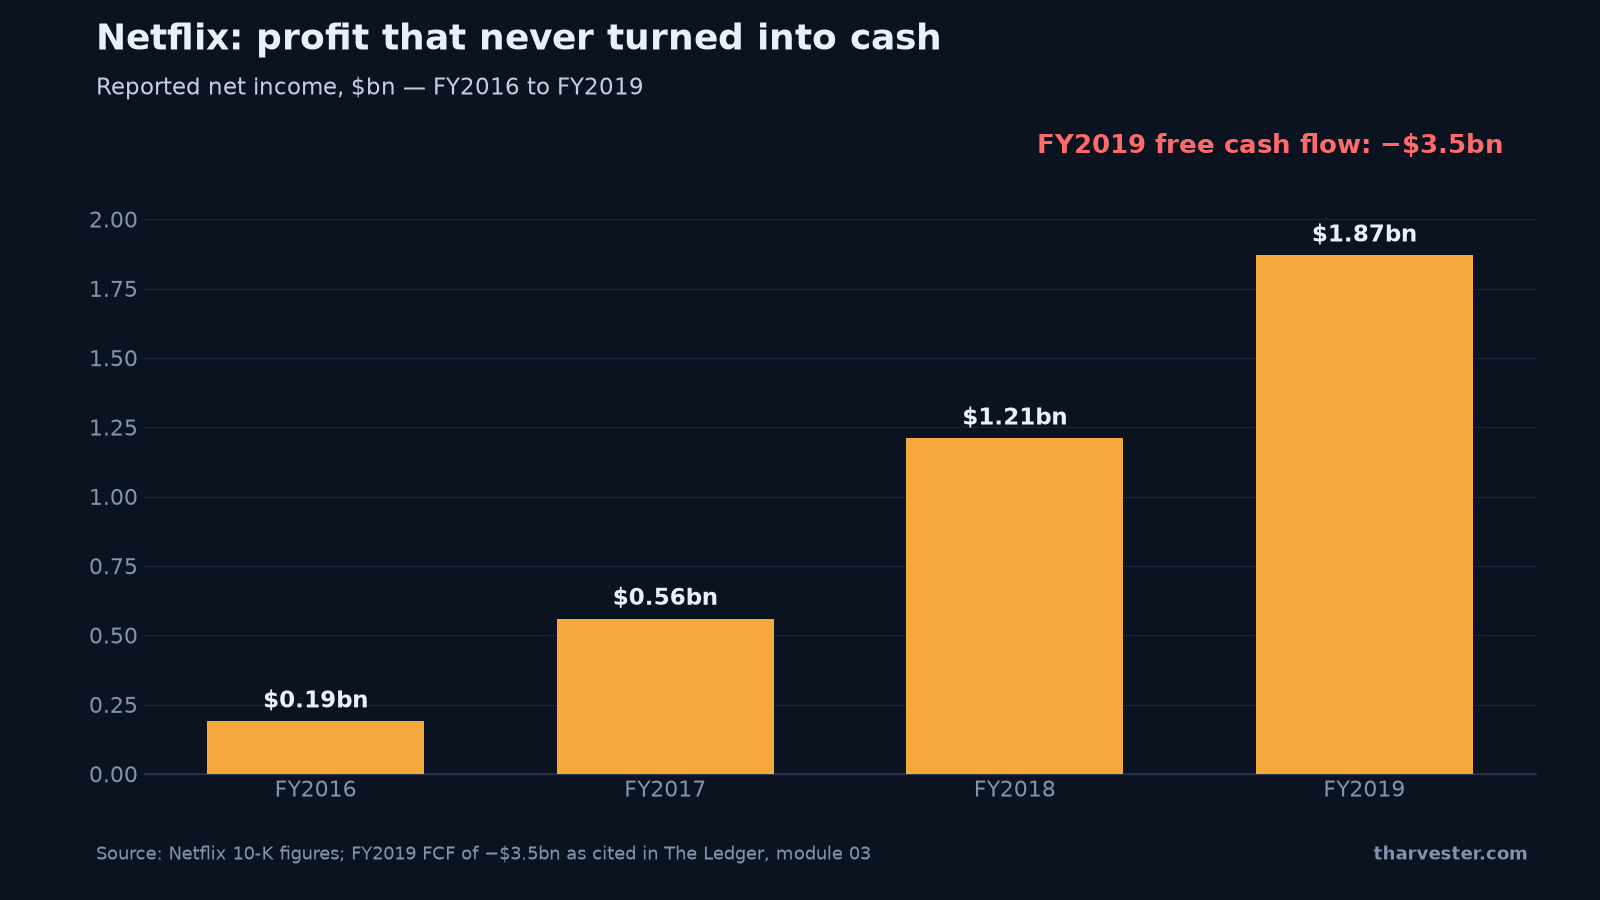
The chart above shows why the distinction pays. It plots Netflix's reported net income by fiscal year — climbing from $0.19bn in FY2016 to $1.87bn in FY2019, a near-tenfold rise. Over that same stretch the cash told the opposite story: in FY2019 alone, free cash flow was −$3.5bn, and Netflix sold $2.2bn of new bonds that October to fund the gap. Nothing illegal, nothing hidden — just an income statement and a bank account describing the same company in different languages. This module of The Ledger teaches you to read both, because telling real profit from reported profit is the main skill of people who bet against companies — and the best defense for everyone who owns them.
Earnings quality analysis starts with one ratio
Almost nothing in this article is about fraud. Most low-quality earnings are produced by ordinary managers under pressure making defensible choices that happen to lean in one direction. Fraud is the far end of the same road — and it is worth knowing what the early stretch looks like.
The first numerical screen is the accrual ratio, which compares profit with cash:
accrual ratio = (net profit − cash from operations) ÷ average total assets
A company reporting $392m of profit with $702m of operating cash flow, on $6,900m of assets, scores (392 − 702) ÷ 6,900 = −4.5%. Negative is good: more cash arrived than profit was claimed. Now flip it. A company reporting $300m of profit with only $90m of operating cash flow on $2,000m of assets scores (300 − 90) ÷ 2,000 = +10.5% — a tenth of the entire asset base is profit that has not turned into money.
The long reading: a negative accrual ratio means the profit is cash-backed, and the dividend or buyback it funds is real. The short reading: a positive and rising ratio across three years means a growing share of reported profit exists only on paper — and across large samples, companies with high accruals go on to deliver poor returns. Watch the direction rather than the level.
Try the arithmetic live. This is the accruals bench from the course:
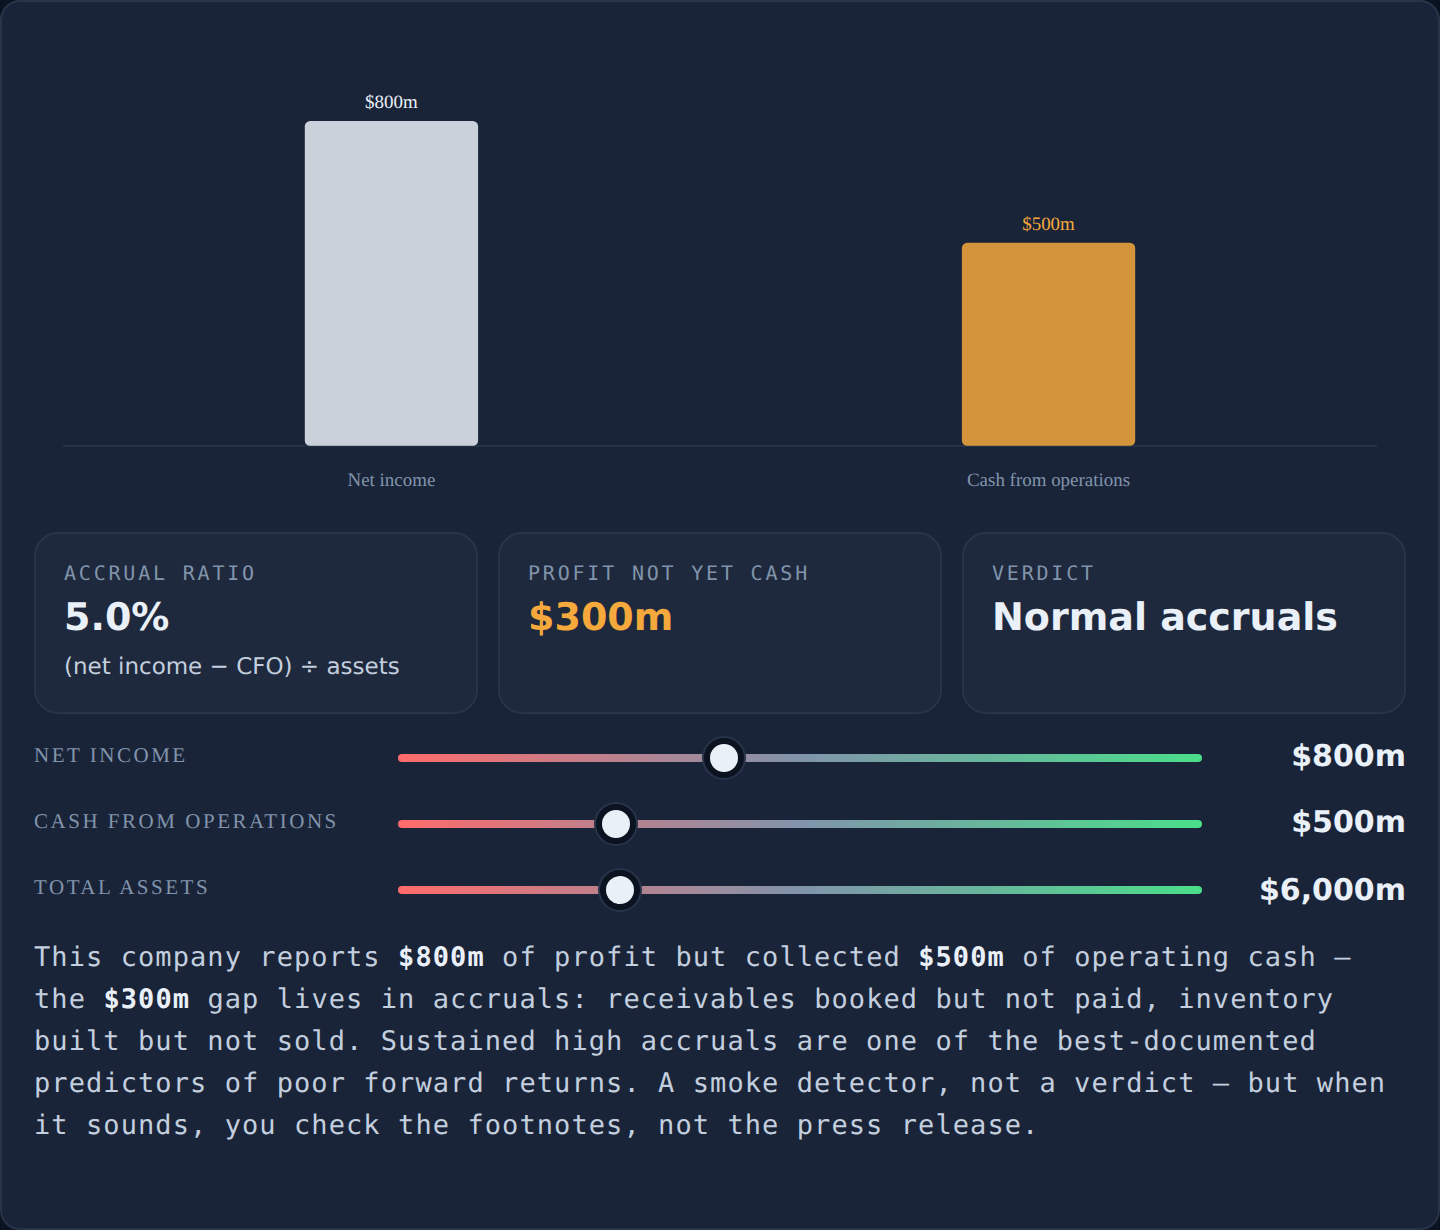
Drag cash from operations down while net income holds still and watch the accrual ratio climb through the color bands — the verdict flips from cash-backed profit to paper profit even though the income statement never changed. Then drag total assets up and notice the same profit-cash gap shrink as a percentage: a $210m gap is alarming on a $2bn balance sheet and a rounding error on a $200bn one, which is exactly why the ratio divides by assets instead of quoting the gap raw.
The Beneish M-score — an eight-variable smoke detector
The Beneish M-score combines eight variables — including collection times, gross margin, asset quality, sales growth and leverage — into a single score designed to flag possible manipulation. Above roughly −1.78, the company warrants a closer look.
Treat both screens the same way: they are smoke detectors. They tell you where to look. They never tell you what you will find. A high accrual ratio at a fast-growing company can be innocent — receivables genuinely grow with sales, a point the revenue growth quality article covers from the other direction. The screens earn their keep by pointing you at the right footnotes.
Wirecard: every accounting red flag was public
Wirecard is the case that justifies the checklist, because every warning was visible in public for years before the collapse. It was a German payments company, briefly worth more than Deutsche Bank and a member of Germany's leading share index. In markets where it held no payment license, it said partner firms processed transactions for it — and the resulting cash sat in escrow accounts held by a trustee at two banks in the Philippines.
- Cash said to be in escrow: €1.9bn — roughly a quarter of the balance sheet
- Cash actually there: €0 — the accounts never existed
- Auditor evidence relied on: screenshots and faxes, for years, in place of bank confirmation
- Collapse: June 2020 — days after the auditor refused to sign
When the auditor finally insisted on contacting the banks directly, both said the same thing: the documents were forgeries, and neither had ever held an account for Wirecard. On 22 June 2020 the company admitted the money probably did not exist.
What makes this a teaching case rather than a horror story is that the pattern was visible. Profits were reported for years while cash generation lagged. The most profitable operations sat in jurisdictions the company did not itself operate in. A large fraction of assets rested on a single third-party arrangement. And journalists raising questions were answered with legal threats rather than bank statements. Each of those is an item on the checklist below.
The accounting red flags checklist — and how to read it
The full module carries an interactive twenty-item forensic checklist you tick against a real annual report. The discipline is in the reading, not the ticking: two or three findings is ordinary corporate life. Several clustered in the same area is a reason to keep going. Three flags spread across unrelated topics is noise; rising collection times, inventory outgrowing revenue, a widening gap between official and adjusted earnings, and a change of auditor — all in the same two years — is one story told four ways.
Know where the flags live, because almost none of this is in the press release, and much of it is not in the main financial statements either. It sits in the notes at the back: the revenue recognition policy, the segment breakdown, the related-party note, and any language about the company's ability to continue trading. The other rich source is the difference between what management said last year and what actually happened.
One section deserves special attention: critical audit matters, in the auditor's report just before the financial statements. These are the areas the auditor found hardest to verify — which means the areas most dependent on management's judgment. Revenue recognition and goodwill valuation are the most common. A professional with full access to the books has already flagged them for you.
Both sides of the same skill
Forensic work is usually described as the short-seller's craft, and the short side module — next in this series — shows how accounting flags become an actual bearish case. But the long investor gets equal value: running the accrual ratio before buying is how you avoid owning the blow-up in the first place. The Ratio Bench computes the accrual ratio alongside forty other metrics from one set of inputs, and the Fundamentals Grader flags cash-conversion problems automatically when you grade a real ticker.
Keep going
The full lesson — Earnings quality: telling real profit from reported profit — includes the complete twenty-item interactive checklist, drills on the accrual ratio and critical audit matters, and the Wirecard case in detail. It is module 10 of The Ledger, free with no signup. Unfamiliar terms live in the glossary, and the next article asks the question that follows naturally once you trust the numbers: what growth does the price imply?
Run the forensic checklist in module 10 — before the market runs it for you.
Frequently asked questions
What is earnings quality?
Earnings quality means how closely reported profit matches economic reality. High-quality profit turns into cash, repeats next year, and does not depend on optimistic assumptions. Low-quality profit exists mainly because of a judgment someone made about when to record a sale or where to put a cost — which is usually ordinary pressure, not fraud, though fraud is the far end of the same road.
How do you calculate the accrual ratio?
Accrual ratio = (net profit − cash from operations) ÷ average total assets. A company reporting $392m of profit with $702m of operating cash flow on $6,900m of assets scores (392 − 702) ÷ 6,900 = −4.5%. Negative means more cash arrived than profit was claimed, which is comfortable. Do it for three years running and watch the direction, not the level.
What is a good accrual ratio?
Negative is good: cash from operations exceeded reported profit, so the profit is cash-backed. A positive and rising ratio across three years means an increasing share of reported profit exists only on paper, and across large samples companies with high accruals go on to deliver poor returns. The trend matters more than any single reading.
What is the Beneish M-score?
The Beneish M-score combines eight variables — including collection times, gross margin, asset quality, sales growth and leverage — into a single score designed to flag possible earnings manipulation. A score above roughly −1.78 warrants a closer look. Like the accrual ratio, it is a smoke detector: it tells you where to look, never what you will find.
What are the biggest accounting red flags in a 10-K?
Profit running ahead of cash for years, collection times drifting up, inventory outgrowing revenue, a widening gap between official and adjusted earnings, heavy reliance on related parties, and a change of auditor. Individually each has innocent explanations. Two or three flags spread across unrelated areas is normal life; three flags clustered in the same area — say, all about revenue and collections — is a story.
Is a change of auditor a red flag?
On its own, no — auditors rotate for ordinary reasons. But an auditor change arriving alongside rising collection times, inventory outgrowing revenue, and a widening adjusted-earnings gap describes one coherent story: profit is being reported before cash arrives and the person paid to check the numbers has just left. Wirecard collapsed within days of its auditor finally refusing to sign the accounts.
What are the signs of channel stuffing?
Channel stuffing means pushing more product to distributors than end customers are buying, so revenue is booked before real demand exists. The signature is receivables growing faster than revenue — collection times drifting up quarter after quarter — often alongside rising inventory in the channel and generous return terms buried in the revenue recognition note. It shows up in the accrual ratio as profit running persistently ahead of cash.
What were the red flags at Wirecard before it collapsed?
Profits were reported for years while cash generation lagged; the most profitable operations sat in jurisdictions where Wirecard itself did not operate; roughly a quarter of the balance sheet — €1.9bn said to be in escrow — rested on a single third-party arrangement; and journalists asking questions got legal threats instead of bank statements. The auditor relied on screenshots and faxes for years. When it finally contacted the banks directly, both said the accounts never existed, and on 22 June 2020 the company admitted the money probably did not exist.