How the Three Financial Statements Connect — One System
Short answer: The three financial statements answer three different questions: the income statement asks whether the company made a profit, the balance sheet asks what it owns and owes right now, and the cash flow statement asks whether money actually arrived. They interlock — net profit flows into retained earnings and starts the cash flow statement, and the three cash flow sections must sum to the change in balance-sheet cash. The gaps between their answers, like Amazon's 2014 loss alongside $6.8bn of operating cash, are where the useful analysis lives.
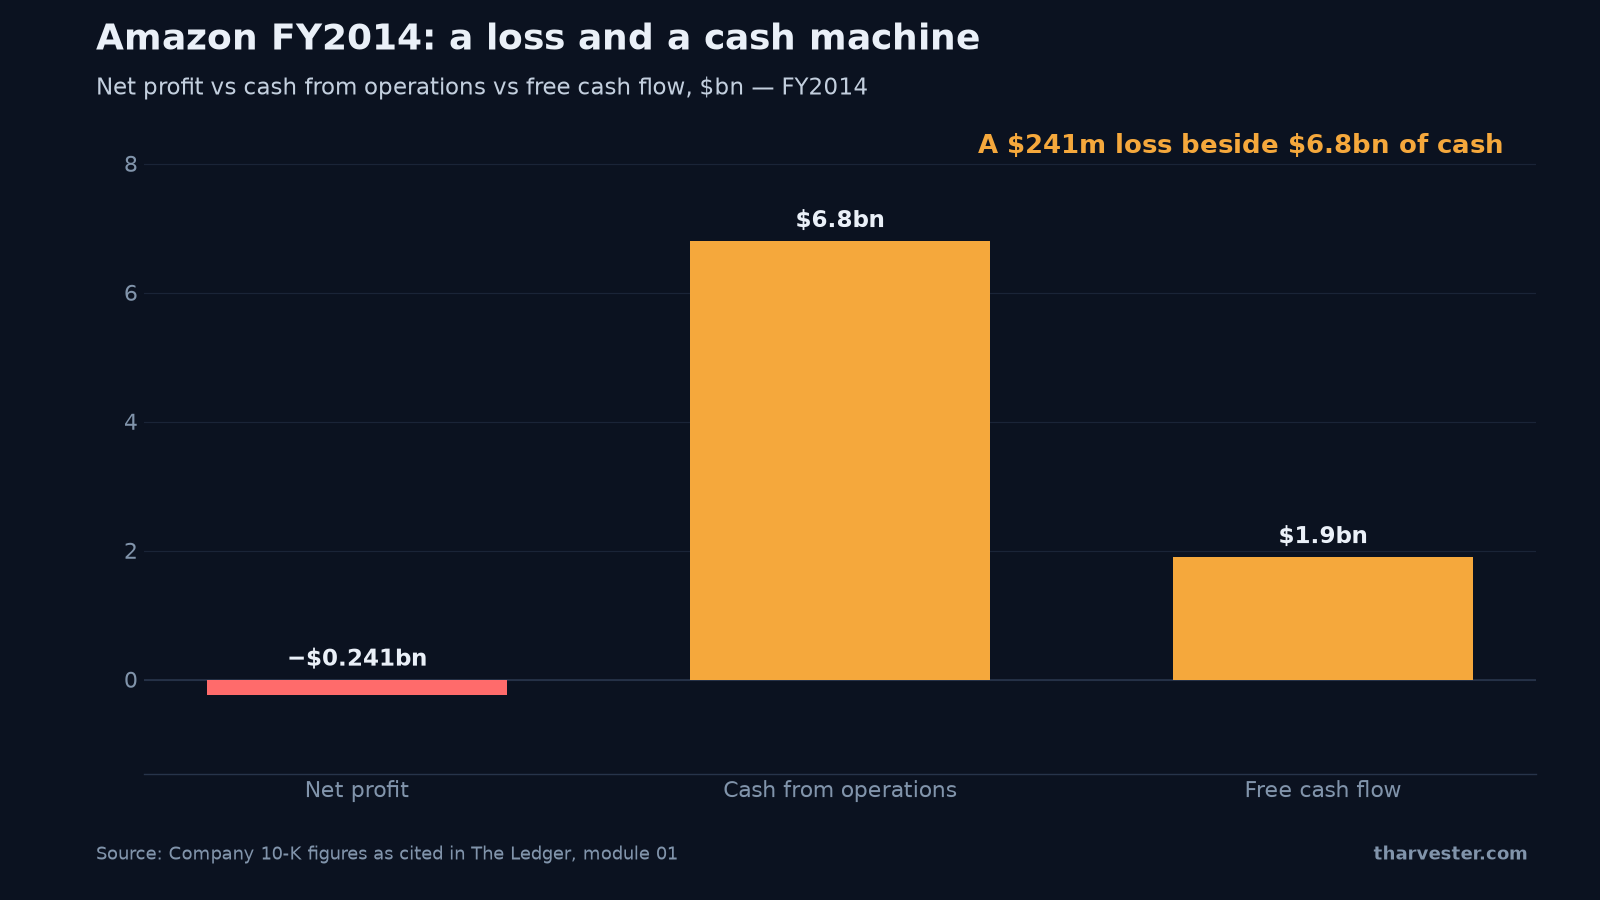
Every ratio in fundamental analysis is two numbers pulled off three pages of a company's accounts. Learn where those pages come from and how they interlock, and the ratios stop being magic. The chart above is the whole argument in one picture: in FY2014, Amazon reported a net loss of $241m — and generated $6.8bn in cash.
The three financial statements answer three different questions
Every listed company publishes accounts once a year — in the United States the filing is called a 10-K — and a shorter version each quarter. Inside are three tables.
- The income statement asks: did the company make a profit this year?
- The balance sheet asks: what does it own and owe right now?
- The cash flow statement asks: did money actually arrive?
Those are not the same question. The gaps between the answers are where most of the useful work in The Ledger, our free fundamental analysis course, gets done.
The income statement: did it make a profit?
The income statement covers a period of time. It starts with what customers were charged and subtracts costs, in order, until only profit is left.
One idea explains most of the confusion around it. Accountants record a sale when goods or services are delivered, not when the cash arrives — deliver $1m of equipment in December, collect in March, and the sale counts in December. That rule is accrual accounting. It gives a fairer picture of a period's trading, and it means reported profit is partly an estimate.
The lines to know, top to bottom:
- Revenue — everything sold in the period, counted when delivered. Ask whether it grew from higher prices (reversible) or more units (stickier).
- Cost of goods sold — the direct cost of the things sold. Gross profit is revenue minus this: what the product itself earns. A grocery chain keeps a few cents per dollar here; a software company can keep 80.
- Operating expenses — the cost of running the company: sales, head office, research. If these grow slower than revenue, profit grows faster than revenue — operating leverage.
- Depreciation and amortization — an accounting charge spreading past purchases over the years they are used. A $10m machine lasting ten years is charged at $1m a year. No money leaves the building now; it left when the machine was bought.
- Operating profit (EBIT) — profit before interest and tax; the cleanest way to compare two companies' trading, since it ignores financing and tax location.
- Net profit — the bottom line, and the number with the most estimates stacked inside it. Treat it as the end of a chain of reasoning, not a fact.
- Earnings per share — net profit divided by share count. Always use diluted EPS, which counts shares already promised to staff and bondholders; the basic figure flatters companies that pay people in stock.
The balance sheet: what does it own and owe?
The balance sheet is a snapshot of one day — usually the last day of the financial year. Assets (what it owns) always equal liabilities (what it owes) plus equity (the difference, in theory what shareholders would keep if everything were sold and every debt repaid). That is not a discovery; it is how the bookkeeping is built. And because it is one day's photograph, companies with something to hide tidy up in the final week — paying down debt just before year end and re-borrowing after.
The useful vocabulary: receivables (money customers owe), inventory (unsold stock), payables (money owed to suppliers), goodwill (the premium paid above fair value in past acquisitions), and deferred revenue — cash customers paid for work not yet delivered, a liability on paper and good news in practice, because customers are funding the business.
One warning deserves bold type: equity is often called book value, and book value is a record of historical cost, not a valuation. A supermarket's 1985 freeholds sit at 1985 prices. A software company's real assets — its code, its customer relationships — are mostly not on the books at all. Goodwill sits at exactly what the last chief executive overpaid.
The cash flow statement: did money actually arrive?
This is the honest page, and it exists because profit is partly an estimate. Three sections:
- Cash from operations (CFO) starts with net profit, adds back charges where no money moved (depreciation, staff paid in shares), then adjusts for changes in inventory, receivables and payables. Out comes the cash the trading actually generated.
- Cash from investing — mostly equipment, property and acquisitions.
- Cash from financing — borrowing, repaying, issuing shares, buybacks, dividends.
Now look at the chart at the top again. Amazon, FY2014: revenue of $88.99bn, up 20% on 2013. Net profit: −$241m, a loss. Cash from operations: $6.8bn. Free cash flow — the cash left after equipment spending — $1.9bn. On the income statement, a loss-making retailer; on the cash flow statement, a cash machine. Both correct. Amazon was charging large depreciation on warehouses and servers paid for in earlier years, and it collects from customers almost immediately while paying suppliers later — so cash arrives before accounting profit does. Neither page was the whole picture. The work was explaining the difference.
Watch profit and cash split apart
The interactive below is the Statements Lab from the course — a tiny company where you control the levers.
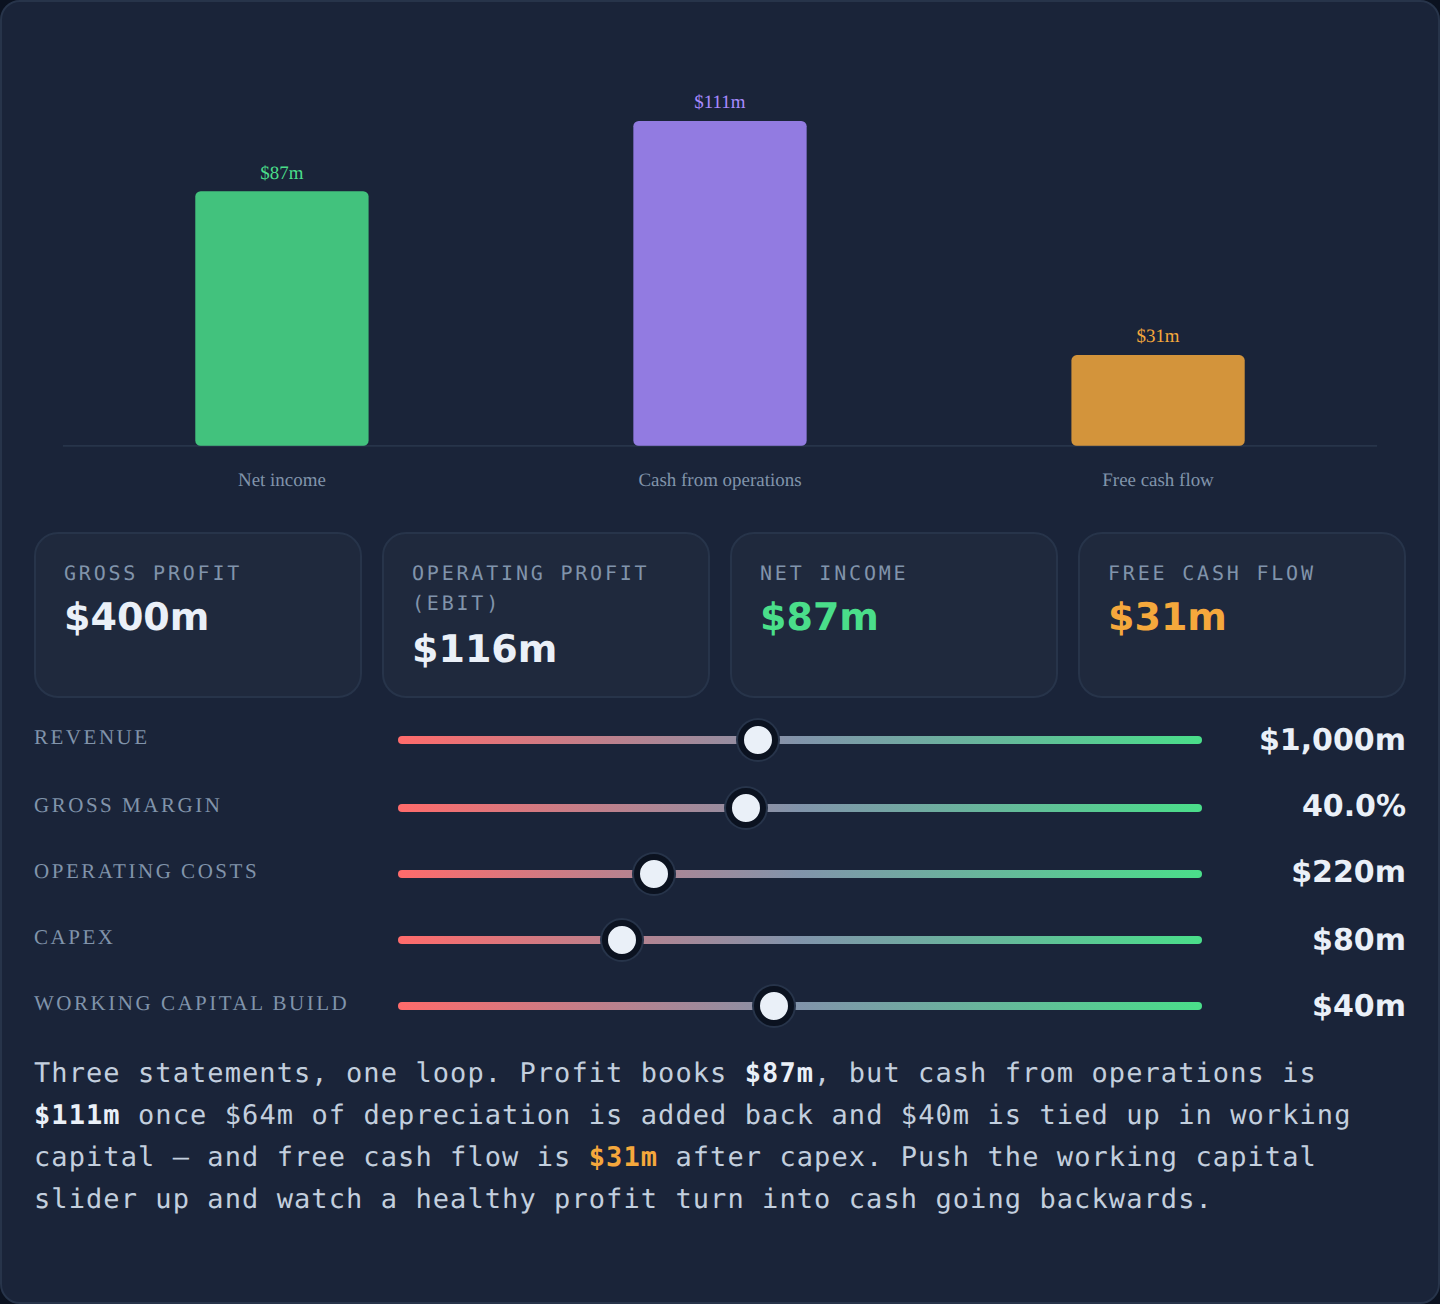
Five sliders: revenue ($m), gross margin (%), operating costs ($m), capex ($m), and the change in working capital ($m). The readouts compute gross profit, operating profit, net income, cash from operations, and free cash flow, and the chart draws net income, CFO and FCF side by side — profit is an opinion, cash is a fact.
Try the Amazon move: push the change in working capital negative (customers pay now, suppliers wait) and watch CFO climb above net income. Then push capex up and watch free cash flow sink while net income does not move at all — capex never touches the income statement in the year it is spent. Once you have made the three bars disagree with your own hands, no headline about "record profits" will ever look the same.
How the three statements interlock
The three pages are one system, and tracing a number around the loop is the real test of understanding:
- Net profit is added to retained earnings on the balance sheet, and starts the cash flow statement.
- Equipment spending appears in investing, sits on the balance sheet as an asset, then returns to the income statement over years as depreciation.
- The three cash flow sections summed must equal the change in the balance sheet's cash line between last year and this year — to the last digit.
That third check is the clearest illustration of the interlock, and it takes two minutes with any real 10-K.
Both sides of "cash is a fact"
The Ledger reads every rule from both sides, and this one earns it. The long reading: a company whose cash from operations consistently exceeds net profit is earning cash-backed profits, and its accounts deserve trust. The short reading: cash can be flattered for a year or two — stretch payables, sell receivables, sell assets, or quietly stop replacing worn-out equipment. A cash surge with a story attached is evidence; a cash surge without one is a question. Always read why cash moved.
Keep going
This article is the companion to Module 01 of The Ledger, where the drills have you pull a real 10-K from sec.gov, walk its income statement line by line, and trace the loop yourself. The previous article, what a stock price actually tells you, explains what all this evidence is for; the next one, market cap vs enterprise value, covers the number you divide everything by. When you want forty ratios computed from these pages automatically, the ratio bench and the Fundamentals Grader are waiting.
Start Module 01: The three statements →
Frequently asked questions
What are the three financial statements?
The income statement, the balance sheet, and the cash flow statement. They appear in every annual report — in the United States the annual filing is called a 10-K. The income statement covers a period and asks whether the company made a profit; the balance sheet is a snapshot of one day and asks what it owns and owes; the cash flow statement asks whether money actually moved.
How do the three financial statements link together?
Net profit from the income statement is added to retained earnings on the balance sheet, and it is also the first line of the cash flow statement. Money spent on equipment appears in the investing section of the cash flow statement, sits on the balance sheet as an asset, and returns to the income statement over following years as depreciation. And the three cash flow sections added together must equal the change in the balance sheet's cash line year over year.
How can a company report a loss but positive cash flow?
Non-cash charges like depreciation reduce reported profit without any money leaving in that year, and a company that collects from customers quickly while paying suppliers slowly pulls cash in ahead of profit. Amazon in FY2014 reported a $241m net loss yet generated $6.8bn of cash from operations — both numbers were correct, and the gap was the interesting part.
What is accrual accounting in plain words?
Accountants record a sale when the goods or services are delivered, not when the cash arrives. Deliver $1m of equipment in December, get paid in March: the sale counts in December. This gives a fairer picture of a period's trading, but it also means reported profit is partly an estimate rather than money in the bank.
Why use diluted EPS instead of basic EPS?
Diluted earnings per share counts shares that do not exist yet but soon will — awards promised to staff, options worth exercising, convertible bonds. Those claims are already committed, and each one shrinks an existing shareholder's slice of the same profit. Basic EPS ignores them, which flatters companies that pay employees in stock. A gap above about 5% means staff are being paid substantially in shares.
Is book value the same as what a company is worth?
No. Equity, or book value, is a record of historical cost, not a valuation. A supermarket's stores bought in 1985 sit on the books at 1985 prices, while a software company's most valuable assets — code and customer relationships — are mostly not on the books at all. Goodwill, meanwhile, sits at exactly what the last chief executive paid above fair value for acquisitions.
Is cash flow harder to manipulate than profit?
Harder, but not impossible. Profit is an opinion and cash is a fact is a good starting rule, yet cash can be flattered for a year or two: paying suppliers later than usual, selling the right to collect customer debts, selling assets, or simply not replacing worn-out equipment. Always read why cash moved, never just that it moved.
What is deferred revenue and why is it good news?
Deferred revenue is cash a customer has already paid for work not yet delivered. It sits on the balance sheet as a liability because the work is still owed — but it means customers are funding the business up front, which is one of the healthiest ways a company can finance itself.