How to Research a Stock — the 10-K Reading Order
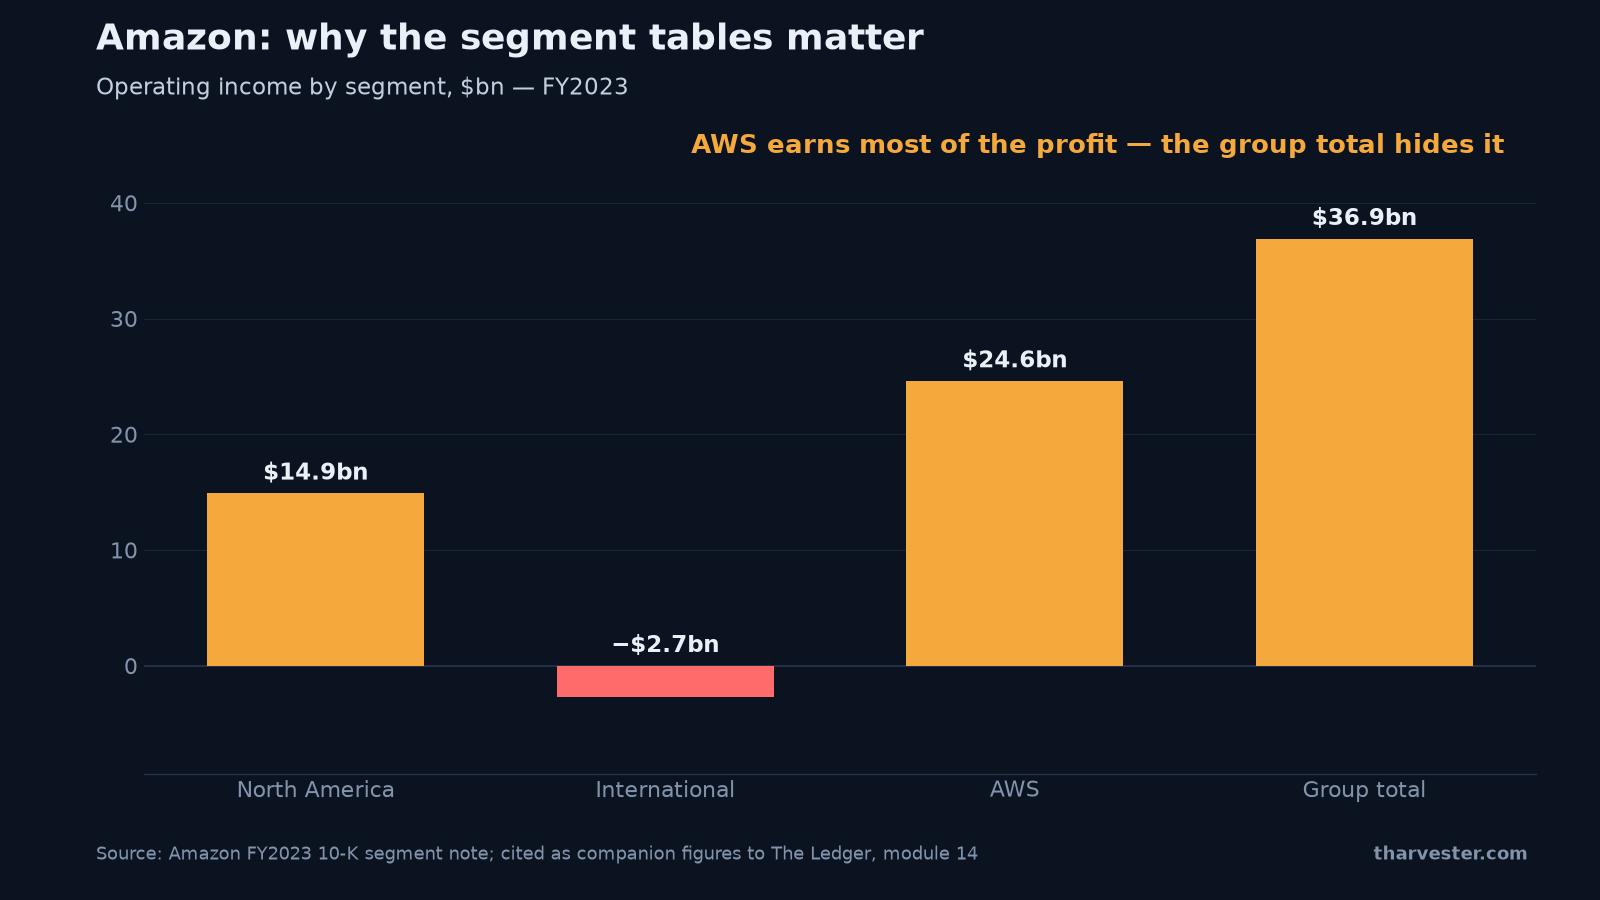
Short answer: Research a stock in a fixed order: business description first, then only the changes in the risk factors, management's discussion, the three financial statements, the notes, and the segment tables — Amazon's FY2023 segments show why, with AWS earning $24.6bn of operating income while International lost $2.7bn inside a $36.9bn group total. Then go outside the filing: earnings call Q&A, guidance versus delivery, competitors' calls. Finally answer what the numbers cannot: unit economics, the moat, customer concentration, and what would kill the business.
An annual report can run to three hundred pages, and most of it does not repay careful reading. Knowing how to research a stock is mostly knowing what to read, in what order, and what question each document answers.
The chart above is the payoff for reading one specific table. Amazon reported $36.9bn of operating income for FY2023 — but the segment note shows AWS earned $24.6bn of it, North America earned $14.9bn, and International lost $2.7bn. One division earns most of the profit; the group total hides that completely. This article lays out the full research sequence from module 14 of The Ledger — the 10-K reading order, the footnotes worth your time, what to read outside the filing, and the four questions the numbers cannot answer.
How to read a 10-K: the reading order
Six stops, in sequence:
- The business description. What does the company actually sell, to whom, and how does it get paid? If you cannot answer those three in your own words, stop — nothing later will help.
- Risk factors — but only the changes. Most of the section is legal boilerplate repeated each year. Put this year's 10-K next to last year's and read only what is new or reworded. Those differences are few and deliberate: someone inside the company decided things had changed enough to say so in a document with legal consequences.
- Management's discussion of results. Their own explanation of the numbers, and the promises they are making. Write the promises down; you will check them next year.
- The financial statements. The three tables from module 01 — income statement, balance sheet, cash flow.
- The notes. This is where the actual work happens (next section).
- The segment tables. Group totals hide everything. Find which division earns the profit, which consumes the capital, and whether the part that is growing is the part that is profitable. Very often it is not — the Amazon chart above is the canonical example, with a loss-making International segment sitting inside a record group profit.
The important footnotes in the financial statements
The notes that reliably repay the time: revenue recognition policy, the segment breakdown, debt, leases, commitments and contingencies, related-party transactions, share-based pay, income taxes — compare the effective rate the company actually paid against the statutory rate and ask why they differ — the assumptions used to test goodwill for impairment, events after the year end, and the auditor's critical audit matters, which are the auditor telling you where the judgment calls live.
That list looks long. It is still a small fraction of the document, and it is where companies put the things they must disclose but would rather you not dwell on.
Outside the filing: transcripts, guidance and competitors
- The remuneration report. Incentives predict behavior — the full treatment is in the previous article on insider buying, ownership and buyback timing.
- The last eight to twelve earnings calls. Skip the prepared statement and read the questions. Note which subjects analysts keep returning to, and which measures management has quietly stopped disclosing — a metric that disappears was almost always deteriorating.
- Guidance given versus guidance delivered. Build a simple table over three to five years. A team that has hit its own guidance has earned the right to be believed about next year; one that has cut guidance repeatedly has not — and that verdict is worth more than any forecast you could build.
- Competitors' reports and calls. Often the single best source on your company. Rivals describe pricing, capacity and demand with no incentive to flatter it.
- Primary sources. Customer reviews, job advertisements (which function is being hired into tells you where the strategy really is), app store rankings, trade press, regulatory inspections, supplier commentary, patent filings, import and export records.
Unit economics analysis: the company at the size of one customer
Four things decide outcomes and appear in no ratio. The first is unit economics — the business stripped down to one customer, one shop, one contract, one vehicle. What does it cost to win, what does it earn, over how long, and how quickly does the upfront cost come back?
The worked example from the module: a subscription business charges $40 a month at a 70% gross margin, and spends $600 of sales and marketing to win each customer.
- Gross profit per customer per month: $40 × 0.70 = $28
- Payback period: $600 ÷ $28 ≈ 21 months
- Value if they stay 4 years: $28 × 48 = $1,344 → $744 profit per customer
Now suppose customers leave after eighteen months instead. Lifetime gross profit becomes $28 × 18 = $504, against $600 spent winning them. Every new customer destroys $96, and growing faster destroys money faster. The company reports the same revenue growth in both cases — only the retention figure separates them, which is why retention is the first number to find in any subscription business.
Build the one-unit view yourself in the course's lab:
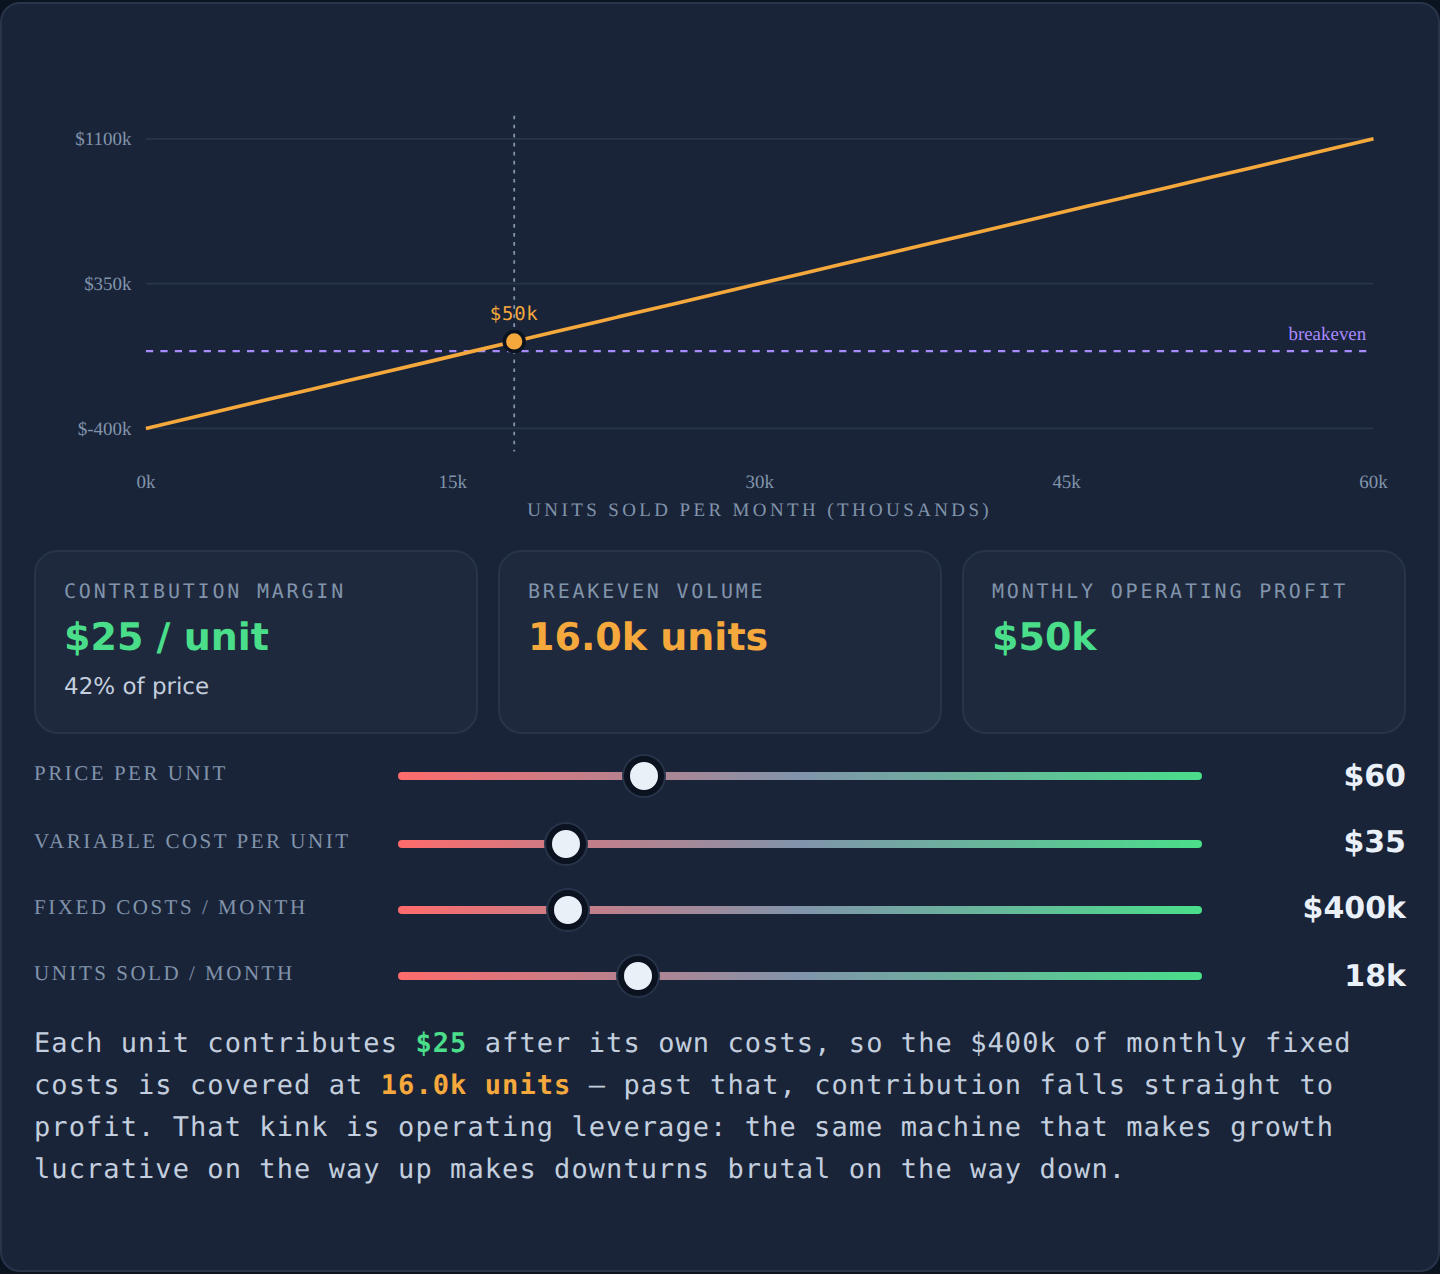
Set the price per unit and the variable cost per unit, and the lab shows the contribution margin per unit and as a percent — what each sale actually contributes after its own costs. Then set fixed costs per month and drag units sold per month across the breakeven point: below it every month loses money, above it the contribution margin on each extra unit drops straight into monthly operating profit. Notice how a small cut to price, with costs unchanged, moves breakeven a long way — that is operating leverage seen from the unit level.
What is a moat — and the one observable test
A moat is a durable reason competitors cannot simply copy the business. There are six real ones: switching costs, network effects, scale economics, intangible assets (brands, patents, licenses), a genuine cost advantage, and regulatory protection. "Good management" and "first mover" are not moats.
Name which one applies — specifically, why a well-funded competitor could not copy the business — then test it with the observable measure: pricing power. Gross margin over five years, alongside whatever the company discloses about pricing. A business that has raised prices faster than inflation without losing volume has a moat. One that cannot has a story about a moat.
Concentration, and writing the obituary
Customer concentration: any customer above roughly 10% of revenue is a disclosed single point of failure. Find the contract terms and the renewal dates.
What would kill it? Write the obituary before you invest — a specific paragraph: the technology that replaced its product, the customer it lost, the debt it could not refinance, the regulator. Then search the current filings for early symptoms of that specific cause of death. If you find them, you have learned something important. If you genuinely cannot, that is a better reason to be interested than any ratio.
And read the other side deliberately. Considering buying? Find the best-argued case against and restate it fairly. Considering betting against? Find the strongest case for. An opposing argument resting on facts you cannot verify is not weak — it is your unmeasured risk, and it should shrink the position.
Keep going
The full lesson — Researching a company: what to read, in what order — turns each step into a drill: diffing two years of risk factors, reading four transcripts' Q&A, computing a payback period, naming and testing a moat, and writing the obituary. It is module 14 of The Ledger, free with no signup. The ratios that feed this process live in the Ratio Bench, the Fundamentals Grader runs the quantitative half on any ticker, and unfamiliar terms are in the glossary. Next in the series: capital cycle investing and industry analysis — because even a perfectly researched company lives inside an industry that sets its ceiling.
Learn the full research sequence in module 14 — and never read a 10-K cover to cover again.
Frequently asked questions
How do you research a stock before buying it?
Work in a fixed reading order that front-loads understanding: the business description (what it sells, to whom, how it gets paid), the changes in the risk factors, management's discussion of results, the three financial statements, the notes, and the segment tables. Then go outside the filing — earnings call Q&A, guidance history, competitors' reports — and finish with the questions numbers cannot answer: unit economics, the moat, concentration, and what would kill it.
What order should you read a 10-K in?
Business description first — if you cannot say what the company sells, to whom, and how it gets paid in your own words, stop, because nothing later will help. Then the risk factors, but only what changed from last year. Then management's discussion, the financial statements, the notes, and finally the segment tables, which is where group totals stop hiding which division actually earns the profit.
Which footnotes in a 10-K matter most?
The ones that reliably repay the time: revenue recognition policy, the segment breakdown, debt, leases, commitments and contingencies, related-party transactions, share-based pay, income taxes (compare the effective rate against the statutory rate), the goodwill impairment assumptions, events after the year end, and the auditor's critical audit matters. The notes are where the actual work happens — the statements are the summary, the notes are the evidence.
Why should you read risk factors as a diff against last year?
Because most of the section is legal boilerplate repeated annually to protect the company from litigation. The signal is the difference: a newly added risk, or a rewritten one, means someone inside the company decided the situation had changed enough to say so in a document with legal consequences. Comparing two years side by side takes minutes and surfaces information almost nobody reads.
What are unit economics in stock analysis?
The business stripped down to one customer, one shop, one contract, one vehicle: what it costs to win, what it earns, over how long, and how fast the upfront cost comes back. A subscription business charging $40 a month at a 70% gross margin earns $28 a month per customer; if winning a customer costs $600, payback takes about 21 months — so the model only works if customers stay well beyond that.
What is a moat, and how do you test one?
A moat is a durable reason competitors cannot simply copy the business, and there are six real ones: switching costs, network effects, scale economics, intangible assets like brands and patents, a genuine cost advantage, and regulatory protection. 'Good management' and 'first mover' are not moats. The observable test is pricing power: gross margin over five years, and whether the company raises prices faster than inflation without losing customers.
Why read earnings call transcripts — and which part?
Skip the prepared statement and read the questions across the last eight to twelve calls. Note which subjects analysts keep returning to and how directly management answers. Then look for a measure that was disclosed a year ago and is not disclosed now — a metric that disappears was almost always deteriorating.
What is customer concentration risk?
Any customer above roughly 10% of revenue is a disclosed single point of failure — companies must report it, so it is findable. The follow-up work is the contract terms and the renewal dates: a large customer with a renewal date inside your holding period is a specific, dated risk, not a vague one.