Market Cap vs Enterprise Value Explained — The EV Formula
Short answer: Market cap is the share price times the diluted share count — the price of the equity only. Enterprise value adds debt, leases, preferred shares and minority interests and subtracts cash: the price of the whole business, regardless of how it is financed. Two companies with identical $5bn market caps can have enterprise values of $2bn and $8bn, pricing the same operating profit four times apart. Get this denominator wrong and every ratio built on it is wrong too.
A $2 share is not cheaper than a $200 share. Before you can say whether a company is cheap, you have to know what the whole thing costs — and the share price alone tells you almost nothing. This is where a large share of amateur analysis goes wrong, because every ratio is a fraction, and this module is about getting the bottom of the fraction right.
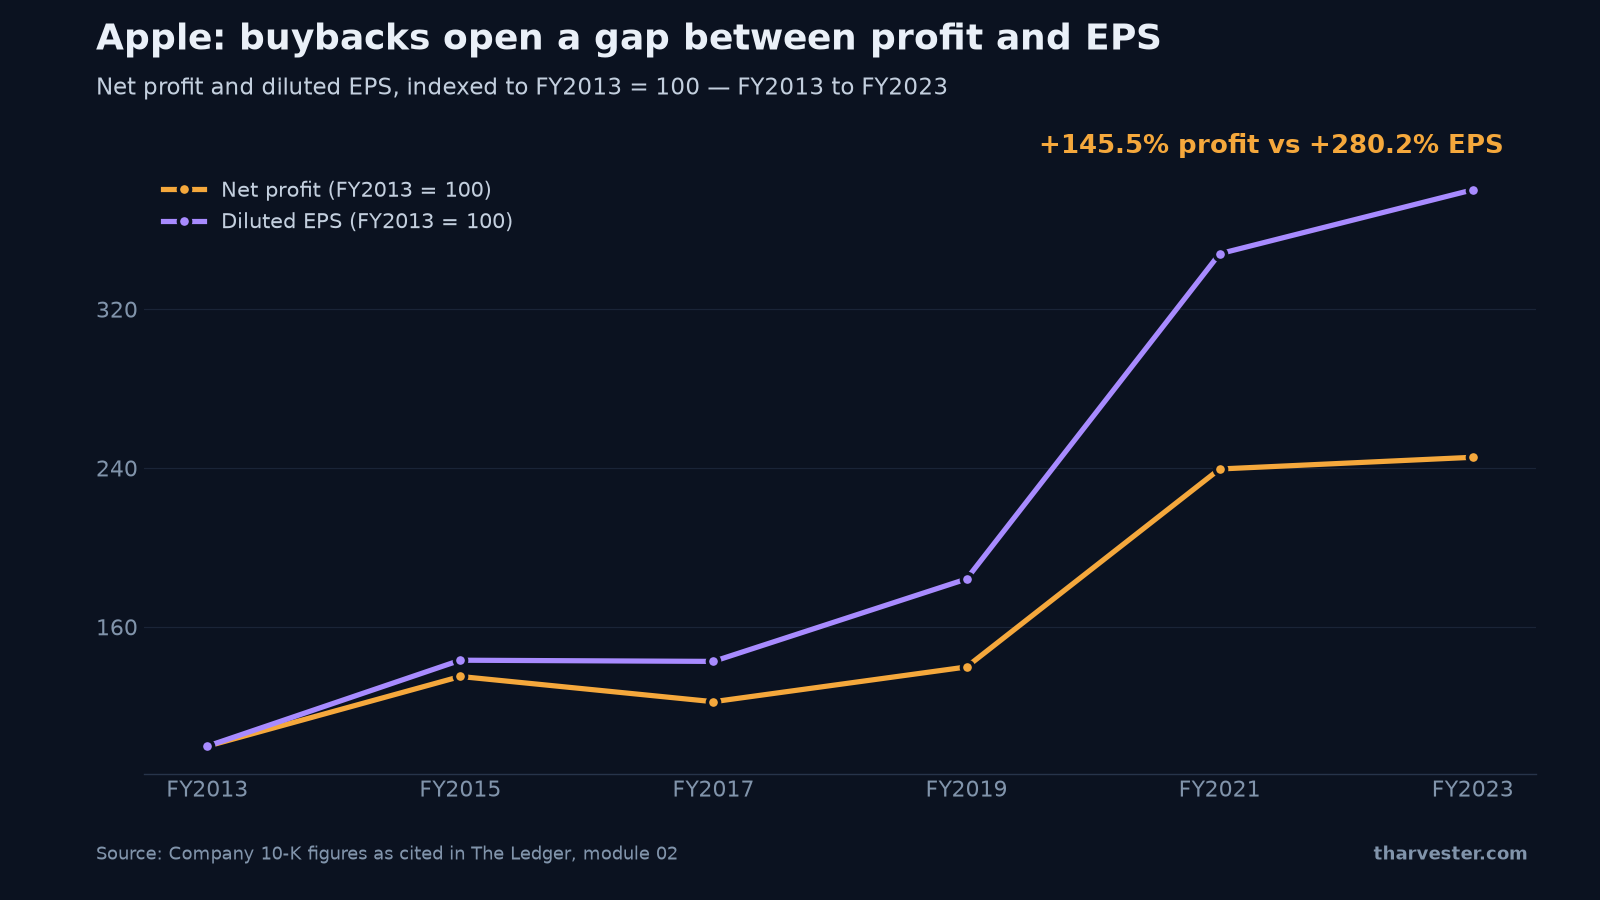
The chart above previews the second half of the story: over ten fiscal years, Apple grew profit 145.5% but grew profit per share 280.2%. The gap is the share count moving. We will come back to it.
Start with the share count — all three of them
- Shares outstanding — how many shares exist today.
- Free float — how many actually change hands. It excludes blocks held by founders, governments and strategic partners who are not selling. A small float makes the price move further on the same buying or selling, and it is what makes a sharp squeeze possible when many people are short at once.
- Diluted shares — shares outstanding plus the ones that will exist soon: share awards promised to staff, stock options worth exercising, bonds that convert into shares. Use this number. Those claims are already committed, and each one shrinks your slice of the same profit.
Market capitalization — market cap — is the share price multiplied by the diluted share count. A company with 1 billion shares at $2 is worth $2bn; a company with 1 million shares at $200 is worth $200m. The "expensive" $200 stock is ten times smaller. Market cap is what the stock market says the equity is worth — but it is not what the business is worth, because most businesses are paid for partly with borrowed money.
What is enterprise value? The price of the whole business
If you bought every share of a company you would own it — but you would also inherit its debts, and you would get to keep the cash in its bank accounts. So the real price of owning the operations is:
Enterprise value = market cap + debt + leases + preferred shares + minority interests − cash
Debt is added because you take it on. Cash is subtracted because you get it, and could immediately use it to pay down part of the purchase. Leases count as debt because a signed lease is a promise to pay for years, whether trading is good or bad. Preferred shares and minority interests are other people's claims that sit ahead of, or alongside, yours.
Enterprise value (EV) lets you compare two companies on how their operations are priced, without the answer being distorted by how each chose to fund itself.
Market cap vs enterprise value: the worked example
Take two companies from the module. Both have a market cap of $5bn. Both earn $500m of operating profit. On the share price alone, identically priced.
- Company A holds $3bn of cash, no debt. EV = $5bn − $3bn = $2bn.
- Company B carries $3bn of debt, no cash. EV = $5bn + $3bn = $8bn.
Measured against operating profit, Company A's operations cost $2bn ÷ $500m = 4 times profit. Company B's cost $8bn ÷ $500m = 16 times. The same business performance is priced four times apart, and the share price hid it completely. This single adjustment is the most common reason a stock that screens cheap is not cheap — and one that screens expensive is not expensive.
Walk the bridge yourself
The interactive below is the EV Bridge Lab from The Ledger, our free fundamental analysis course.
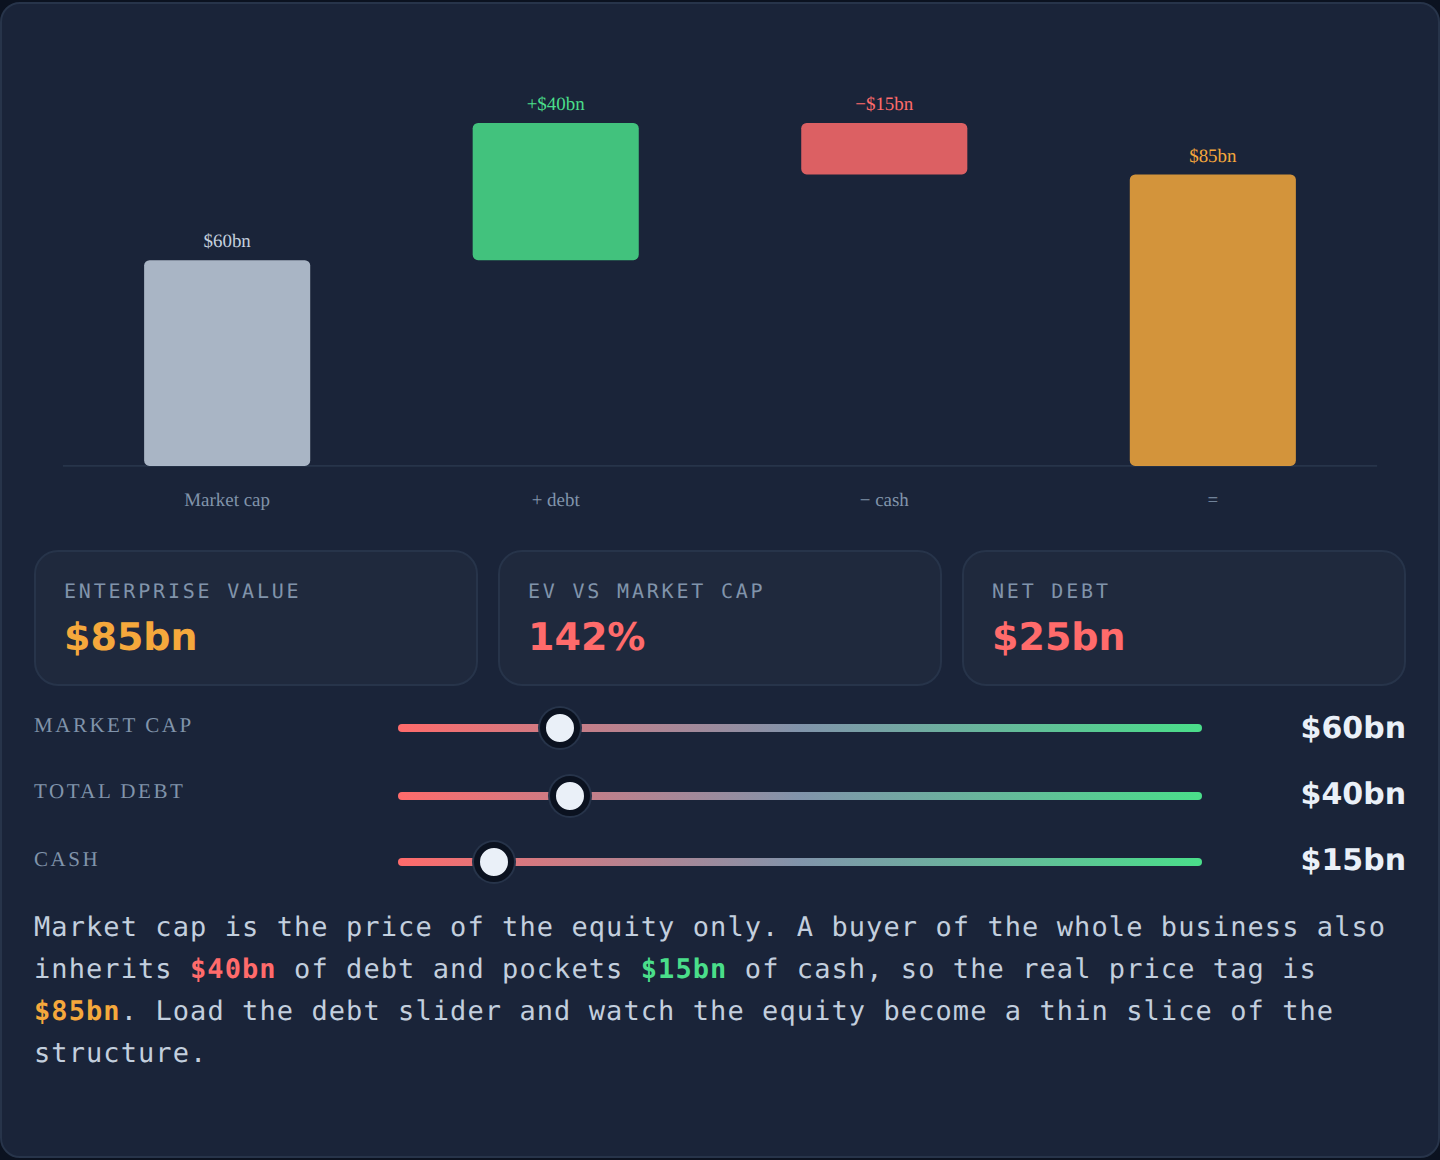
Three sliders: market cap, total debt, and cash, each in $bn. The readouts show the resulting enterprise value and EV as a percentage of market cap, and the chart draws the bridge: market cap → +debt → −cash → EV.
Drag debt up and watch enterprise value climb while market cap stands still — the equity's share of the business shrinking in front of you. Then drag cash above debt and watch EV drop below market cap: you are now paying less for the operations than the share price suggests. When EV runs to a multiple of market cap, you are looking at a leveraged balance sheet where lenders, not shareholders, hold the larger claim.
Both sides: net cash cushion, leveraged sliver
The Ledger reads every number from both sides, and EV versus market cap earns it.
The long reading. A company holding more cash than debt has an EV below its market cap. You are buying the operating business for less than the share price suggests, and the spare cash is useful in its own right — it can buy back shares, fund an acquisition, or carry the company through a downturn while weaker competitors cut back.
The short reading. A heavily indebted company has an EV far above its market cap, and the shares behave like a small slice at the end of a long queue. Work the module's numbers: a business worth $10bn in total, funded by $2bn of equity and $8bn of net debt. If the business turns out to be worth 20% less — $2bn less — the lenders are still owed their $8bn in full. The entire loss lands on the shareholders, who are wiped out. A 20% fall in the business became a 100% loss on the shares. Cheap-looking equity in a leveraged business is often not a bargain; it is a bet on solvency.
Dilution: the transfer nobody announces
The share count is not fixed, and the direction it moves matters enormously, because your claim is a fraction with the share count on the bottom. Companies push the count up mainly through stock-based compensation — paying employees in shares — and by issuing stock to raise money. They pull it down by buying shares back and canceling them.
Now the chart from the top of this article, properly explained. Apple began a very large buyback program in 2013 and has spent more than $550bn since. Over the ten years to FY2023, its diluted share count fell roughly 40% (adjusting for the 7-for-1 split in 2014 and the 4-for-1 in 2020, which change the count without changing what you own). The result, indexed to FY2013 = 100 in the chart: net profit grew 145.5%, while diluted EPS grew 280.2%. By FY2024, shares outstanding had fallen again, from 15.81bn to 15.41bn — another 2.56% in a single year.
Read the gap carefully. Roughly half of Apple's EPS growth came from the business earning more, and roughly half from there being fewer shares to divide it between. Both are real. But they are different things, and only one can continue indefinitely.
One caution on stock-based compensation: the cash flow statement adds it back as "non-cash", which is technically true — the company handed over ownership, not money. It is still a real cost, and it is paid by you. The test to run on any company: total five years of buyback spending, total five years of SBC, then compare the diluted count now against five years ago. If the count barely moved, the buyback was not returning capital — it was covering staff pay.
Keep going
This article is the companion to Module 02 of The Ledger, where drills walk you through computing market cap and EV from a real 10-K and running the buyback-versus-SBC test. It builds directly on how the three financial statements connect — the balance sheet supplies the debt and cash — and it feeds straight into the next article, valuation multiples explained from both sides, where EV becomes the numerator of the most honest ratios. For fast checks, the ratio bench computes EV-based multiples from raw figures, and the Fundamentals Grader scores any real ticker in seconds.
Start Module 02: Share count, market cap, enterprise value →
Frequently asked questions
What is the difference between market cap and enterprise value?
Market capitalization is the share price multiplied by the diluted share count — what the market says the equity is worth. Enterprise value is market cap plus debt, leases, preferred shares and minority interests, minus cash: the price of the whole operating business. Market cap tells you what the shares cost; enterprise value tells you what the company costs.
How do you calculate enterprise value?
Enterprise value = market cap + debt + leases + preferred shares + minority interests − cash. Debt is added because a buyer of the whole company takes it on. Cash is subtracted because the buyer gets it and could immediately use it to pay down part of the purchase. In practice: take total borrowings from the balance sheet, add them to market cap, subtract cash and equivalents.
Why is cash subtracted from enterprise value?
Because if you bought every share, the company's bank account would be yours. That cash could immediately repay part of what you spent, so the true cost of owning the operations is lower by exactly the cash held. By the same logic debt is added, because you inherit the obligation to repay it.
Can enterprise value be lower than market cap?
Yes — whenever a company holds more cash than debt. A $5bn market cap company with $3bn of cash and no debt has an enterprise value of $2bn, so the operating business costs far less than the share price suggests. The reverse also holds: heavy debt pushes enterprise value far above market cap.
What is the difference between shares outstanding, float, and diluted shares?
Shares outstanding is how many shares exist today. Free float is the portion that actually trades — it excludes blocks held by founders, governments and strategic partners. Diluted shares add the shares that will exist soon: staff share awards, options worth exercising, and convertible bonds. Use the diluted count, because those claims are already committed and each one shrinks your slice of the profit.
Is stock-based compensation really a cost?
Yes. The cash flow statement adds it back as a non-cash item, which is technically true — the company handed over ownership instead of money. But it is a real cost, paid by existing shareholders out of their share of the business. Every share issued to staff puts your claim over a larger share count.
How do share buybacks increase earnings per share?
EPS is profit divided by share count, so shrinking the bottom of the fraction raises the result even when profit is flat. Over Apple's FY2013 to FY2023, net profit grew 145.5% while diluted EPS grew 280.2% — roughly half the per-share growth came from more than $550bn of buybacks cutting the split-adjusted share count by about 40%.
How do you tell if a buyback is real or just offsetting dilution?
Add up five years of buyback spending and five years of stock-based compensation from the cash flow statement, then compare today's diluted share count with the count five years ago. If the count actually fell, the buyback returned capital. If it barely moved, the buyback only mopped up shares issued to employees — that is payroll, not a return of capital.