Net Debt to EBITDA & Interest Coverage Ratio, Explained
Short answer: Net debt to EBITDA is (total debt minus cash) divided by EBITDA — roughly how many years of cash profit it would take to repay the borrowings. Under 2x is conservative, 3-4x is stretched, above 5x is fragile, with wide variation by industry. Pair it with the interest coverage ratio (operating profit divided by interest expense): below 2x is a warning, below 1x means operations do not cover the interest bill at all. Then read the debt note, because the repayment calendar — not the ratio — is what turns leverage into a crisis.
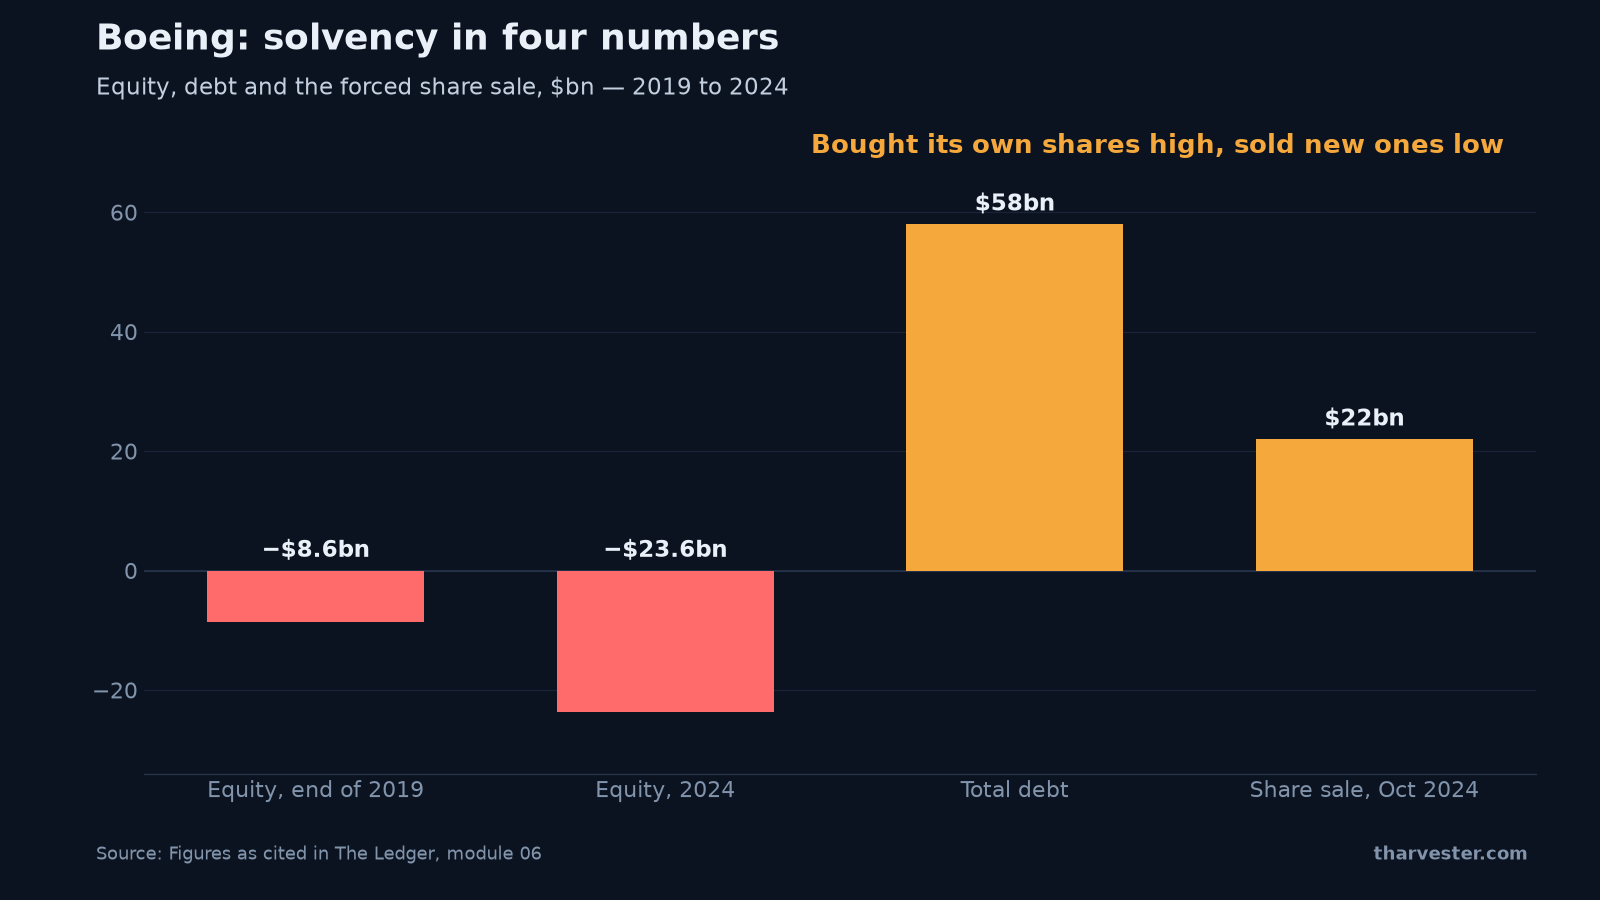
Most shares that go to zero do not do so because the business was bad. They do so because a payment fell due. Net debt to EBITDA and the interest coverage ratio are the two numbers that tell you whether a company can survive its own borrowings — and the chart above shows what it looks like when the answer turns out to be no. Boeing entered its crisis years with negative shareholders' equity, carried total debt toward $58bn, and in October 2024 sold roughly $22bn of new shares to avoid a credit downgrade. We will come back to how that was visible in advance.
This article is the companion to module 06 of The Ledger, ThetaHarvester's free fundamental analysis course.
What net debt to EBITDA actually measures
Debt is borrowed money that must be repaid on fixed dates whether trading is good or bad. Net debt is total debt minus cash, because cash in the bank can be used to repay borrowings — and net debt is the figure every leverage ratio should be built on.
EBITDA — earnings before interest, tax, depreciation and amortization — is a rough proxy for the cash profit the operations throw off. Divide one by the other and you get the ratio lenders themselves use:
Net debt / EBITDA = roughly how many years of cash profit it would take to repay the borrowings.
The bands, with wide variation by industry: under 2x is conservative, 3-4x is stretched, above 5x is fragile.
Working the leverage ratios on a real balance sheet
The Ledger runs one manufacturer's figures through every solvency ratio. Debt $1,850m, cash $420m, operating profit $657m, depreciation $310m, interest expense $96m, current assets $2,380m, current liabilities $1,520m, inventory $790m.
- Net debt = 1,850 - 420 = $1,430m
- EBITDA = 657 + 310 = $967m
- Net debt / EBITDA = 1,430 / 967 = 1.48x — conservative
- Interest coverage = 657 / 96 = 6.8x — the trading profit covers the interest bill almost seven times over
- Current ratio (current assets / current liabilities) = 2,380 / 1,520 = 1.57 — next year's assets cover next year's bills
- Quick ratio (the same, minus inventory) = 1,590 / 1,520 = 1.05 — still covered even if none of the stock could be sold
That is a comfortable balance sheet. One caveat on the current ratio: below 1 usually needs an explanation, but it is normal and healthy for supermarkets, which are paid by customers before they pay their suppliers.
The stress test: halve EBITDA before the market does
Ratios measured in good times flatter everyone. So change one figure. If a downturn halved this company's EBITDA to $484m, net debt to EBITDA would become 1,430 / 484 = 3.0x and interest coverage would fall to around 3.6x. Stretched, but survivable — and that is the point of measuring it before the downturn rather than during it.
You can run that exact stress test live in the LedgerLab below.
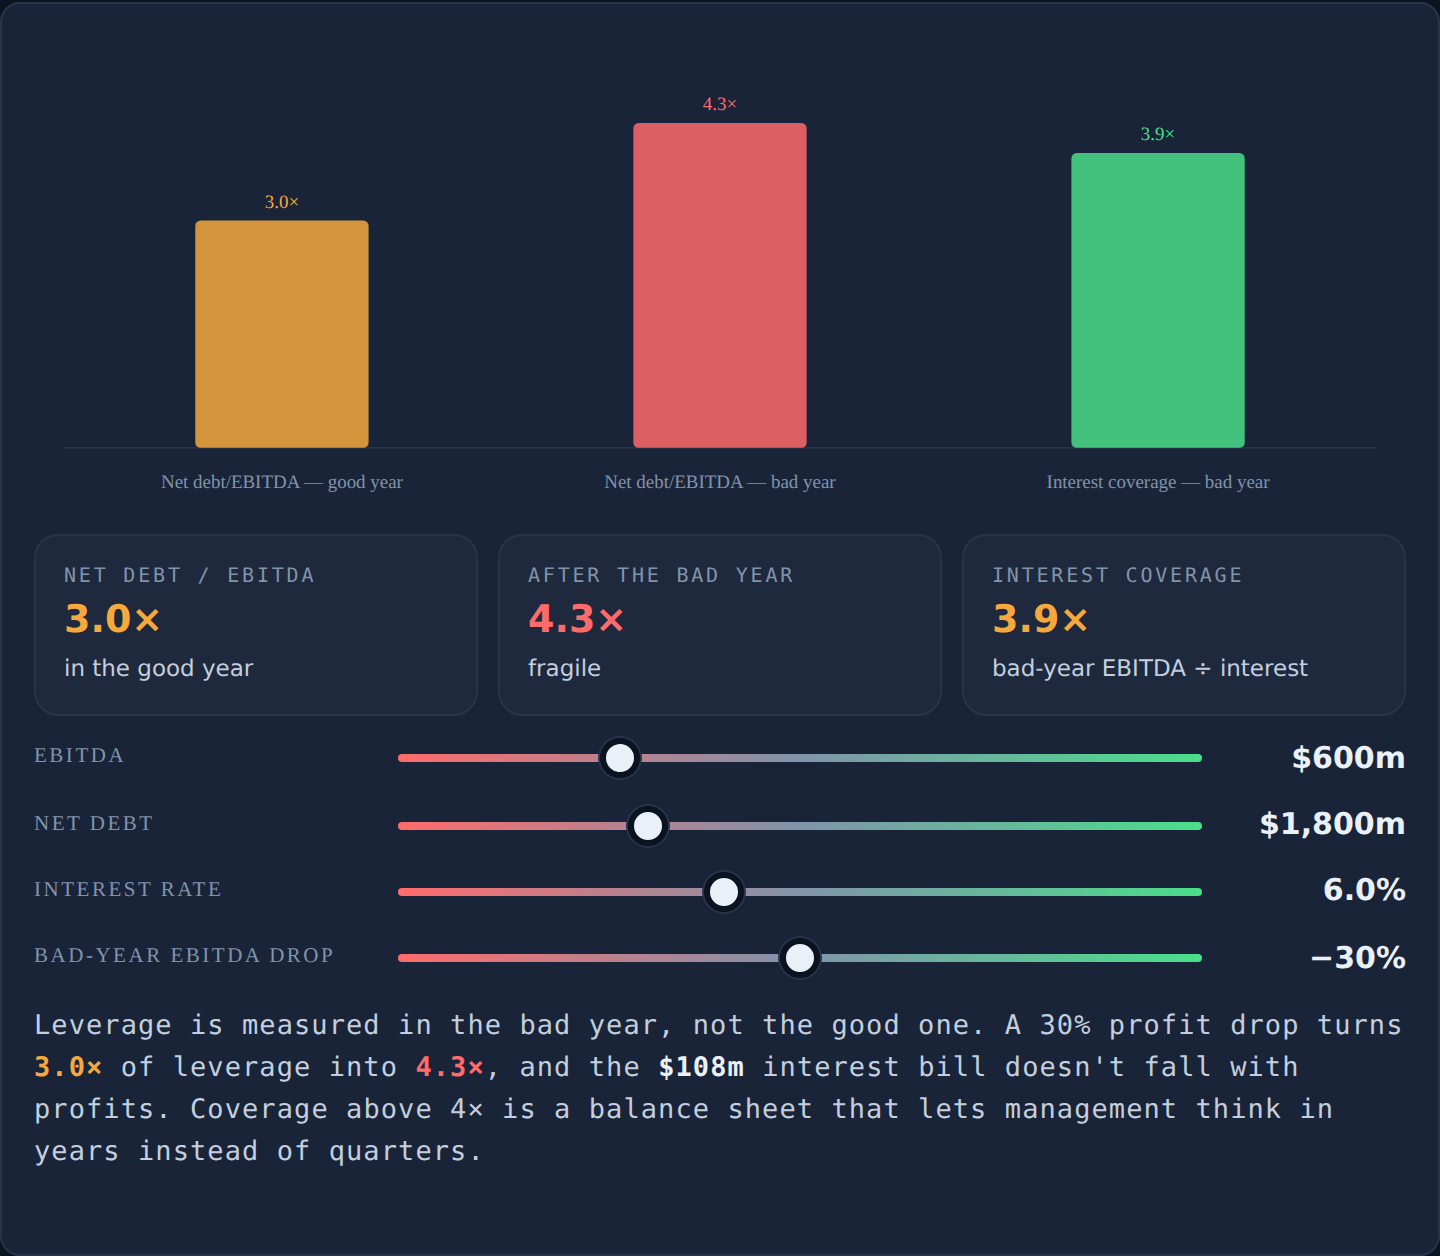
Set EBITDA to $967m, net debt to $1,430m, and the interest rate near where the company actually borrows. The readouts show net debt to EBITDA before and after the bad year, interest coverage after it, and a verdict band — conservative, stretched, or fragile. Now drag the EBITDA decline in a bad year slider toward 50% and watch 1.5x become 3.0x without the company borrowing another dollar. That is what a recession does to a leverage ratio: the numerator sits still while the denominator collapses.
Then push net debt higher and repeat. The companies that migrate from stretched to fragile on a routine downturn are the ones whose equity behaves like an option on survival.
The maturity wall: why the calendar beats the ratio
Here is the question The Ledger uses to make the point. Company one has net debt of 3x EBITDA, interest coverage of 4x, and no borrowings due for six years. Company two has net debt of 2x EBITDA, coverage of 5x, and must refinance half its debt in nine months. Which is riskier?
The second one. Ratios describe the size of the debt; the calendar decides whether it becomes a crisis. A company facing a maturity wall — a large refinancing at a fixed date — has to go to the market regardless of conditions, and if that market is hostile it refinances at a much higher rate or issues shares cheaply.
The fix is unglamorous: read the debt note in the annual report in full. It lists every borrowing, its interest rate, its maturity date and its conditions (covenants). Write out how much falls due in each of the next five years. Then find the revolving credit facility — the company's overdraft — and check how much is already drawn and when it expires. A company whose revolver expires the same year as a large bond has two problems arriving together.
Boeing 2019-2024: what no cushion looks like
Boeing is the clearest recent case of a strong business becoming a fragile investment through financing decisions rather than trading ones, and it is the story in the chart at the top of this page.
Between 2013 and 2019 the company spent roughly $43bn buying back its own shares. Buybacks come straight out of equity, and equity is the cushion that absorbs losses — so by the end of 2019, shareholders' equity was already negative $8.6bn. Then the 737 MAX groundings and the pandemic arrived. Losses pushed equity to negative $23.6bn by 2024, total debt climbed toward $58bn, and in October 2024 the company sold roughly $22bn of new shares to avoid a credit downgrade.
Read the sequence from a shareholder's chair: the company bought its own shares when they were expensive and sold new ones when they were cheap. That is the exact opposite of what creates value — and it was visible in advance, not from the profit line, but from watching equity shrink while debt grew. The next article in this series, on capital structure and WACC, takes that mechanism apart properly.
Debts that are not called debt
Several obligations rank ahead of shareholders without appearing under the heading "debt": lease commitments, pension shortfalls, extra payments still owed on past acquisitions, provisions for lawsuits and decommissioning — and supply-chain finance, where a bank pays the company's suppliers early and the company repays the bank later. It sits among payables rather than debt, but it functions as borrowing, and several large collapses turned on exactly this. Search the notes for "leases", "pension", "contingencies" and "supplier finance", add what you find to the balance-sheet debt figure, and you have a number closer to what the company really owes.
The liquidity runway calculation
For any company spending more cash than it generates, this is the most valuable single calculation available:
Months of runway = (cash + undrawn committed facilities) / monthly cash burn
A company with $180m of cash burning $15m a month has 180 / 15 = 12 months. Below roughly twelve months, raising money becomes likely. Below six, it becomes close to certain — usually at a discount to the market price, with extra rights attached for the new investors. Both come out of existing shareholders, at which point dilution stops being an opinion and becomes arithmetic.
Two screening tools round out the module: the Altman Z-score (a five-factor bankruptcy model — above 2.99 safe, below 1.81 the distress zone) and the Piotroski F-score (nine yes/no tests of improving fundamentals — 8-9 strengthening, 0-2 deteriorating). Both are for ranking a list, never for forming an argument.
Reading leverage from both sides
The Ledger reads every metric from both directions, and leverage earns it.
The long reading. Debt increases returns to shareholders when the cash flows are contractual and predictable — utilities, mobile phone masts, long-let property. And paying debt down is itself a way for shareholders to get richer: if the whole business stays worth the same while the lenders' claim shrinks, the shareholders' slice grows without the business improving at all.
The short reading. Borrowing plus unpredictable trading is the standard setup for a collapse. What matters is not the ratio but the calendar: when do the loans fall due, at what rate will they be replaced, and which covenant is closest to breach? A forced refinancing into an unwelcoming market is a dated, mechanical problem — the rarest and most valuable thing to find when betting against a company.
Keep going
This article covers one module of a seventeen-part course. The full lesson — Debt, and whether the company can survive it — adds the drills: reading a real debt note, totalling the hidden claims, and running the runway calculation on a loss-making company, with a quiz to make it stick.
Before this in the series: free cash flow quality and SBC. After it: capital structure, leverage and WACC. To compute every ratio in this article from one set of inputs, use the Ratio Bench; for any term that is new, the glossary has it; and to see how a real ticker's balance sheet scores against its sector, run it through the Fundamentals Grader.
Start module 06: leverage and solvency — free, no signup.
Frequently asked questions
What is a good net debt to EBITDA ratio?
Under 2x is conservative, 3x to 4x is stretched, and above 5x is fragile — with wide variation by industry. A regulated utility with contractual revenue can safely carry more than a carmaker whose sales can halve in a recession. The ratio answers one question in the credit market's own language: roughly how many years of cash profit would it take to repay the borrowings.
How do you calculate net debt to EBITDA?
Take total debt, subtract cash, and divide by EBITDA (operating profit plus depreciation and amortization). A company with $1,850m of debt, $420m of cash, $657m of operating profit and $310m of depreciation has net debt of $1,430m and EBITDA of $967m, so net debt to EBITDA is 1,430 / 967 = 1.48x — comfortably conservative.
What is a good interest coverage ratio?
Interest coverage is operating profit divided by interest expense — how many times over the trading profit covers the interest bill. Below 2x is a warning, and below 1x means the operations do not cover the interest at all. A company earning $657m against a $96m interest bill covers it 6.8 times, which leaves plenty of room for a bad year.
What is a debt maturity wall?
A maturity wall is a large amount of debt falling due in a short window. It matters more than any ratio, because a company that must refinance into a hostile credit market has a dated, mechanical problem: it refinances at a much higher rate, sells assets cheaply, or issues shares at a discount. The maturity schedule is listed loan by loan in the debt note of the annual report.
How do you calculate a company's cash runway?
Months of runway = (cash + undrawn committed facilities) / monthly cash burn. A company with $180m of cash burning $15m a month has 180 / 15 = 12 months. Below roughly twelve months a share issue becomes likely; below six it becomes close to certain — and it usually happens at a discount, which comes out of existing shareholders.
What is the Altman Z-score?
The Altman Z-score is a weighted five-factor bankruptcy model. Above 2.99 is the safe zone, 1.81 to 2.99 is uncertain, and below 1.81 is the distress zone. It was built for manufacturers, other versions exist for other industries, and it is a tool for ranking a list of companies rather than for forming an argument about one.
What is the Piotroski F-score?
The Piotroski F-score runs nine yes/no tests of whether a company's fundamentals improved over the past year — profitability, leverage, and efficiency. A score of 8-9 signals strengthening fundamentals, 0-2 signals deterioration. Like the Altman Z-score, it is a screening tool for ranking candidates, not a thesis.
What debts do not appear as debt on the balance sheet?
Lease commitments, pension shortfalls, extra payments owed on past acquisitions, provisions for lawsuits and decommissioning, and supply-chain finance — where a bank pays the company's suppliers early and the company repays the bank later. Supply-chain finance sits among payables rather than debt, but it functions as borrowing, and several large collapses turned on exactly this.