Organic vs Acquired Growth — Price, Volume & Growth per Share
Short answer: Not all revenue growth is worth the same multiple. Break every growth rate into its parts before paying for it: organic vs acquired (check goodwill growth against revenue growth), price vs volume (flat volumes with price-driven revenue is a demand warning dressed as growth), new customers vs existing ones (net revenue retention above 100% means the base grows on its own), and always per diluted share — revenue up 20% on a share count up 15% is only about 4% growth per share.
"Revenue grew 20%" is not a fact you can act on. It is a summary of several different things that happened — some of which will repeat, and some of which will not. Before paying a higher multiple for a growth rate, take it apart: organic vs acquired growth, price vs volume, new customers vs existing ones, and always, always per share.
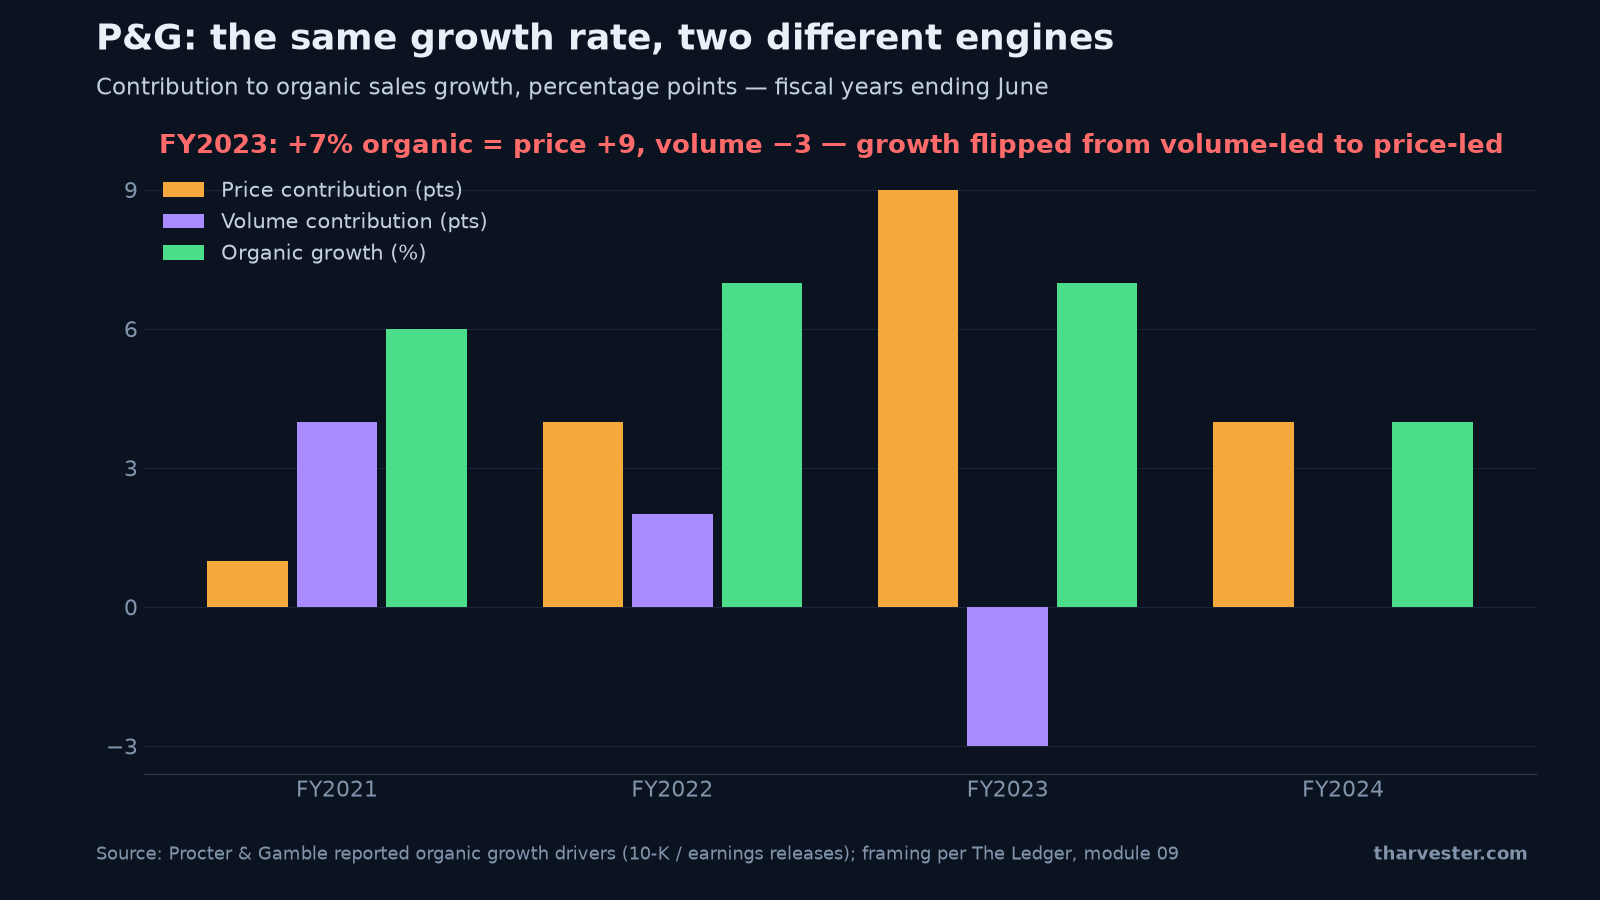
The chart above shows why the split matters, using Procter & Gamble's disclosed organic growth drivers by fiscal year. In FY2022 and FY2023 P&G reported roughly the same 7% organic sales growth — but underneath, the mix flipped. FY2023's growth came from roughly nine points of price with volumes down about three — the same headline number, carried by a completely different and less repeatable engine. That flip is invisible in the revenue line and obvious in the split, which is the entire argument of this article and of module 09 of The Ledger.
Organic vs acquired growth: did it earn the growth, or buy it?
Organic growth is growth from the business the company already owned. Acquired growth comes from buying other companies. Both show up in the same revenue line, and they are worth very different amounts.
Acquired growth costs money, carries the risk that two businesses do not combine well, and can be repeated only as long as there are targets to buy and money to buy them with. A serial acquirer can produce a smooth-looking growth record for years while quietly destroying value, if it pays more for each business than that business earns.
Two checks, both fast. First, look for the like-for-like or organic figure — most companies disclose it, and a company that has stopped disclosing it is telling you something. Second, compare the growth in goodwill on the balance sheet with the growth in revenue over three years, and check acquisition spending in the cash flow statement. If goodwill is growing much faster than revenue, the revenue is being purchased.
Price vs volume growth: the same 8% twice
Revenue is price multiplied by volume, so a single growth rate can describe two opposite situations. The module's worked example puts two companies side by side, both reporting revenue up 8%:
- Company A: prices +3%, volumes +4.9% — more units, to more people.
- Company B: prices +12%, volumes −3.6% — fewer units, to fewer people, at higher prices.
Company B's growth works until customers find an alternative or simply buy less. Its 8% may already be the last good year. Volume is the honest measure of demand; pricing power is only demonstrated when prices rise without volumes falling. In consumer businesses this split is usually disclosed, and reading it is one of the highest-value twenty minutes available — the P&G chart above took exactly that long to build.
Now run the decomposition live. This is the growth-quality bench from the course:
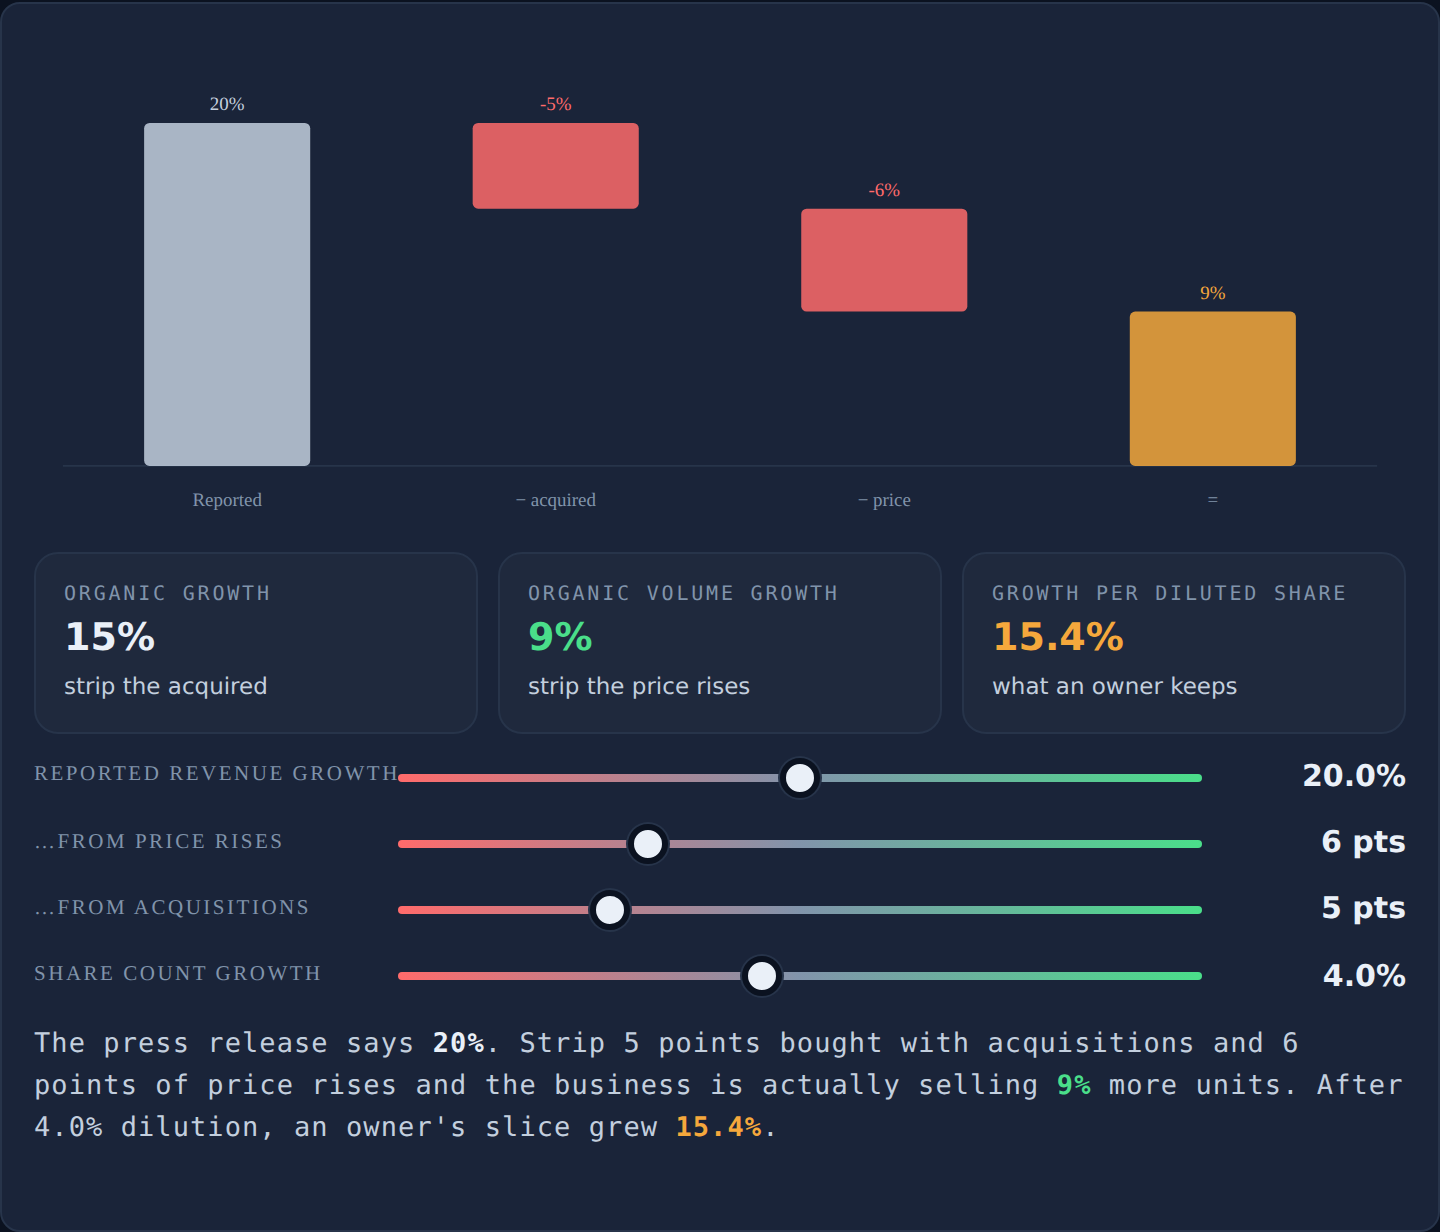
Set reported revenue growth to 8%, then drag the share of growth from price rises toward 100% and watch the organic volume growth readout sink below zero — Company B, reproduced with a slider. Next add a few points of growth from acquisitions and watch organic growth fall away from the headline number while it stays unchanged. Finally, push diluted share count growth up and watch the revenue growth per share readout shrink — the last readout is the only one of the three that measures what your claim on the business actually gained.
Net revenue retention: new customers, or existing ones spending more?
For subscription businesses the key measure is net revenue retention: what last year's customers spend this year, including those who left and those who expanded.
Above 100%, the existing customer base grows on its own — the company could stop winning new customers entirely and still grow. Below 100%, the base shrinks and the sales team has to run to keep the company standing still. The difference between 120% and 95% is the difference between two entirely different businesses that can report the same headline growth for a year or two. Watch the direction too: a fall from 130% to 105% describes a business changing character while the headline still looks healthy.
The indicators that turn before revenue does
Revenue is a lagging report of decisions customers already made. These turn earlier:
- Backlog and remaining performance obligations — work contracted but not yet delivered. Next year's revenue, disclosed today.
- Order intake and book-to-bill — new orders divided by revenue billed. Above 1, the order book is growing; below 1, today's revenue is being taken from a shrinking backlog.
- Deferred revenue — cash collected for work not yet delivered.
- Currency — exchange-rate moves flatter or depress reported revenue with no change in the business. Use the constant-currency figure.
- The comparison base — a big percentage increase against a collapsed prior year is not a growth rate. Compare against two and three years earlier as well.
If a forward measure grows more slowly than revenue, the company is eating its backlog — and revenue follows the forward measure eventually, not the other way round.
Revenue growth per share: the test most people skip
Growth is only worth paying for when it is funded at returns above the cost of capital and does not require issuing ever more shares. So measure it per share. A company whose revenue rises 20% while its diluted share count rises 15% has grown revenue per share by only about 4% — it grew the business and handed most of the gain to new shareholders. Do the same calculation for profit and for free cash flow; for some companies, dilution accounts for most of the headline growth.
Read from both sides, the whole module compresses to one contrast. The long reading: organic, volume-led growth with retention above 100% and a flat share count is the rarest and most valuable kind, and it deserves a premium multiple. The short reading: price-led growth with falling volumes, acquisition-fed revenue with ballooning goodwill, or headline growth that vanishes per share is growth that is already ending — often while the multiple still prices it as permanent. The Fundamentals Grader checks share-count growth against revenue growth automatically, and the Ratio Bench computes the per-share series from raw filing figures.
Keep going
The full lesson — Growth: where it came from, and whether it was worth having — adds drills on a real consumer company's price/volume split, a software company's retention, and the per-share calculation on your own ticker. It is module 09 of The Ledger, free with no signup. It builds on the previous article, the cash conversion cycle, which tells you whether growth is affordable; next comes earnings quality and the red-flag checklist, which tells you whether the numbers are real at all. Terms along the way live in the glossary.
Take a growth rate apart in module 09 — and never pay for 20% again without knowing which 20% it was.
Frequently asked questions
What is the difference between organic and acquired growth?
Organic growth comes from the business the company already owned; acquired growth comes from buying other companies. Both land in the same revenue line, but they are worth very different amounts: acquired growth costs capital, carries integration risk, and can only be repeated while there are targets to buy and money to buy them with. Look for the like-for-like or organic figure in the report — a company that has stopped disclosing it is telling you something.
How can you tell if a company is buying its growth?
Compare the growth in goodwill on the balance sheet with the growth in revenue over the same three years, and check the acquisitions line in the cash flow statement. Goodwill growing much faster than revenue means the revenue is being purchased, not earned. A serial acquirer can produce a smooth-looking growth record for years while quietly destroying value, if it pays more for each business than that business earns.
What does price vs volume growth tell you?
Revenue is price times volume, so one growth rate can describe opposite situations. A company growing 8% from +3% prices and +4.9% volumes is selling more to more people. One growing 8% from +12% prices and −3.6% volumes is selling less, to fewer people, at higher prices — which works until customers find an alternative. Flat or falling volumes with price-driven revenue is a demand problem presented as a growth number.
What is a good net revenue retention rate?
Net revenue retention measures what last year's customers spend this year, including churn and expansion. Above 100% means the existing base grows on its own — the company could stop winning new customers and still grow; below 100% the sales team runs to keep the company standing still. The direction matters as much as the level: a fall from 130% to 105% describes a business changing character even while headline growth still looks healthy.
What are the red flags of a serial acquirer?
Goodwill growing much faster than revenue, a steady stream of acquisitions in the cash flow statement, and no disclosed organic growth figure. The pattern can manufacture EPS growth indefinitely while destroying value, because each deal adds revenue regardless of the price paid. The test is whether revenue has actually grown to match the money spent, and what returns past acquisitions delivered against the promises made at the time.
What is revenue growth per share and why does it matter?
It is revenue divided by diluted share count, tracked over time — the growth that actually accrues to your claim on the business. A company whose revenue rises 20% while its share count rises 15% has grown revenue per share by only about 4%: it grew the pie and handed most of the gain to new shareholders. Run the same calculation on profit and free cash flow before paying a premium for any growth rate.
Which indicators turn before revenue does?
Backlog and remaining performance obligations (work contracted but not yet delivered — next year's revenue, disclosed today), order intake and book-to-bill (above 1 means the order book is growing), and deferred revenue (cash collected for work not yet delivered). If a forward measure grows more slowly than revenue, the company is working through its backlog rather than replacing it, and revenue will eventually follow the forward measure down.
Why can a high growth rate off a weak prior year be misleading?
Because a large percentage increase measured against a collapsed base is not a growth rate — it is a recovery. Compare against two and three years earlier as well as last year, and use the constant-currency figure for companies selling abroad, since exchange-rate moves flatter or depress reported revenue with no change in the underlying business.