ROIC vs WACC Explained — When Growth Destroys Value
Short answer: ROIC is after-tax operating profit divided by invested capital (debt plus equity minus cash); WACC is the blended cost of that capital. Growth creates value only when ROIC exceeds WACC — a company earning 6% on reinvested money that costs 9% loses 3 cents a year on every dollar it retains, and faster growth makes it worse. Margins describe the product; the ROIC-vs-WACC spread decides whether growth is worth having at all.
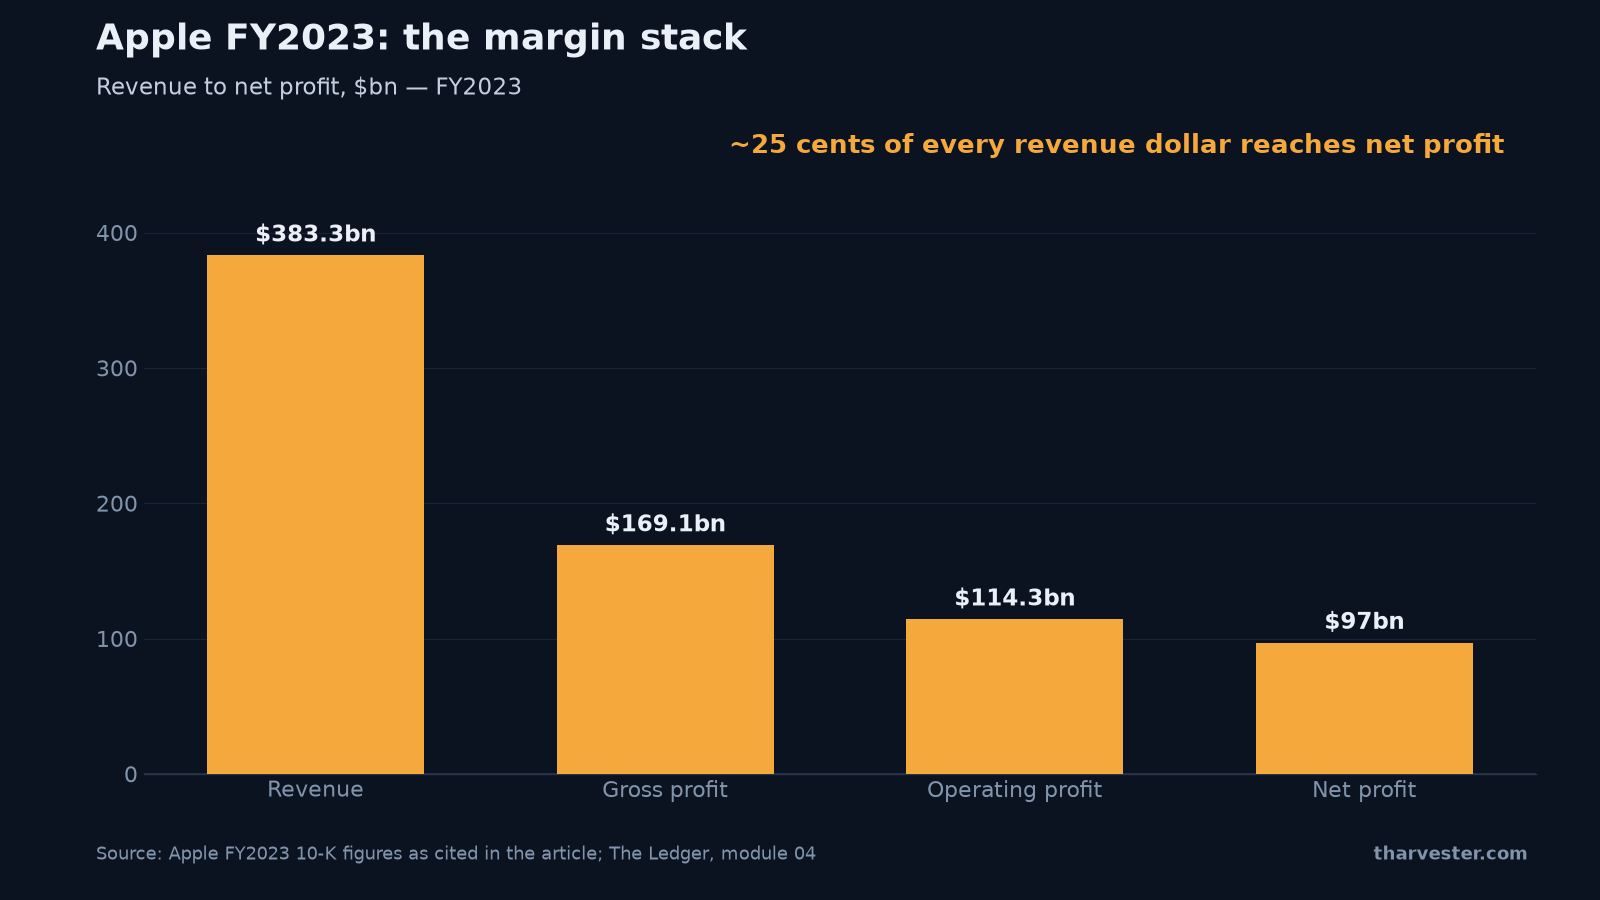
ROIC vs WACC is the comparison that governs everything else in fundamental analysis. Margins tell you what the product earns; the return on invested capital, held against the cost of that capital, tells you whether growth is worth having at all. Get this one spread right and half of the valuation debate resolves itself.
Start with margins, because they are the raw material. The chart above shows Apple's FY2023 income statement as a stack: $383.3bn of revenue narrowing to $169.1bn of gross profit, $114.3bn of operating profit, and $97.0bn of net profit. Each step down is a different set of costs, and the gaps between the bars are more informative than any single figure — Apple keeps about 25 cents of every revenue dollar as net profit, which is the end of a story the other bars tell.
The margin stack: read the gaps, not the levels
A profit margin is profit divided by revenue. There is more than one, because there is more than one definition of profit. Module 04 of The Ledger works the whole stack on a components manufacturer with revenue of $6,200m:
- Gross margin 29.0% — gross profit $1,798m ÷ $6,200m. What the product itself earns.
- Operating margin 10.6% — operating profit $657m ÷ $6,200m. What is left after sales teams, head office and research.
- Net margin 6.3% — net profit $392m ÷ $6,200m. After interest and tax.
Read the gaps. Of every $1 of sales, 29 cents survives the cost of making the product; running the company consumes another 18 cents; interest and tax take a further 4.3. That last gap deserves attention: roughly 40% of operating profit is going somewhere other than shareholders. Find out how much is interest, and you have learned who this company is really working for.
Direction beats level. A 22% margin risen from 18% and a 22% margin fallen from 30% describe two completely different companies. Then compute the incremental margin — the change in operating profit divided by the change in revenue — because that is the economics of the next dollar of sales, which is what you are actually buying.
Returns on capital: the more important half
Margins say nothing about how much money had to be tied up to earn them. A business earning $10m on $50m of invested capital is a far better business than one earning $10m on $500m, whatever their margins look like. Four measures, in rising order of usefulness:
- Return on equity (ROE) = net profit ÷ shareholders' equity. Easy to find, easy to mislead with — borrowing raises it, and so do buybacks, because buybacks shrink equity.
- Return on assets (ROA) = net profit ÷ total assets. Blunter, harder to flatter.
- Return on invested capital (ROIC) = after-tax operating profit ÷ invested capital, where invested capital is debt plus equity minus cash. The central quality measure.
- Incremental ROIC = the change in after-tax operating profit ÷ the change in invested capital over three to five years. What new money earns — the figure that decides whether growth helps or hurts.
How to calculate ROIC — the worked example
Same manufacturer, from the module. Operating profit $657m, tax rate 24%, debt $1,850m, equity $2,450m, cash $420m.
After-tax operating profit: 657 × (1 − 0.24) = $499m. Invested capital: 1,850 + 2,450 − 420 = $3,880m. ROIC: 499 ÷ 3,880 = 12.9%. Cash is subtracted because money sitting in the bank is not being used to run the business.
Now the judgment. If this company can raise debt and equity at a blended cost of capital of 8–9%, then earning 12.9% means every dollar reinvested creates roughly 4 cents a year of value. If its cost of capital were 15%, the same 12.9% would be destroying value with every dollar reinvested — no matter how fast revenue grew.
ROIC vs WACC: the rule that governs everything
Growth creates value only when the return on invested capital exceeds the cost of that capital. Above the line, growth deserves a premium price and reinvesting beats paying dividends. Below the line, growth destroys value, and every dollar retained should have been paid out instead.
Run the module's quiz case: a company grows revenue 25% a year while earning 6% ROIC against a 9% cost of capital. It loses 3 cents a year on every dollar reinvested, so growing faster makes the hole deeper. That is why a fast-growing company earning below its cost of capital is one of the most reliable short archetypes — the destruction compounds with every year of expansion.
You can feel this rule work in the course's interactive lab:
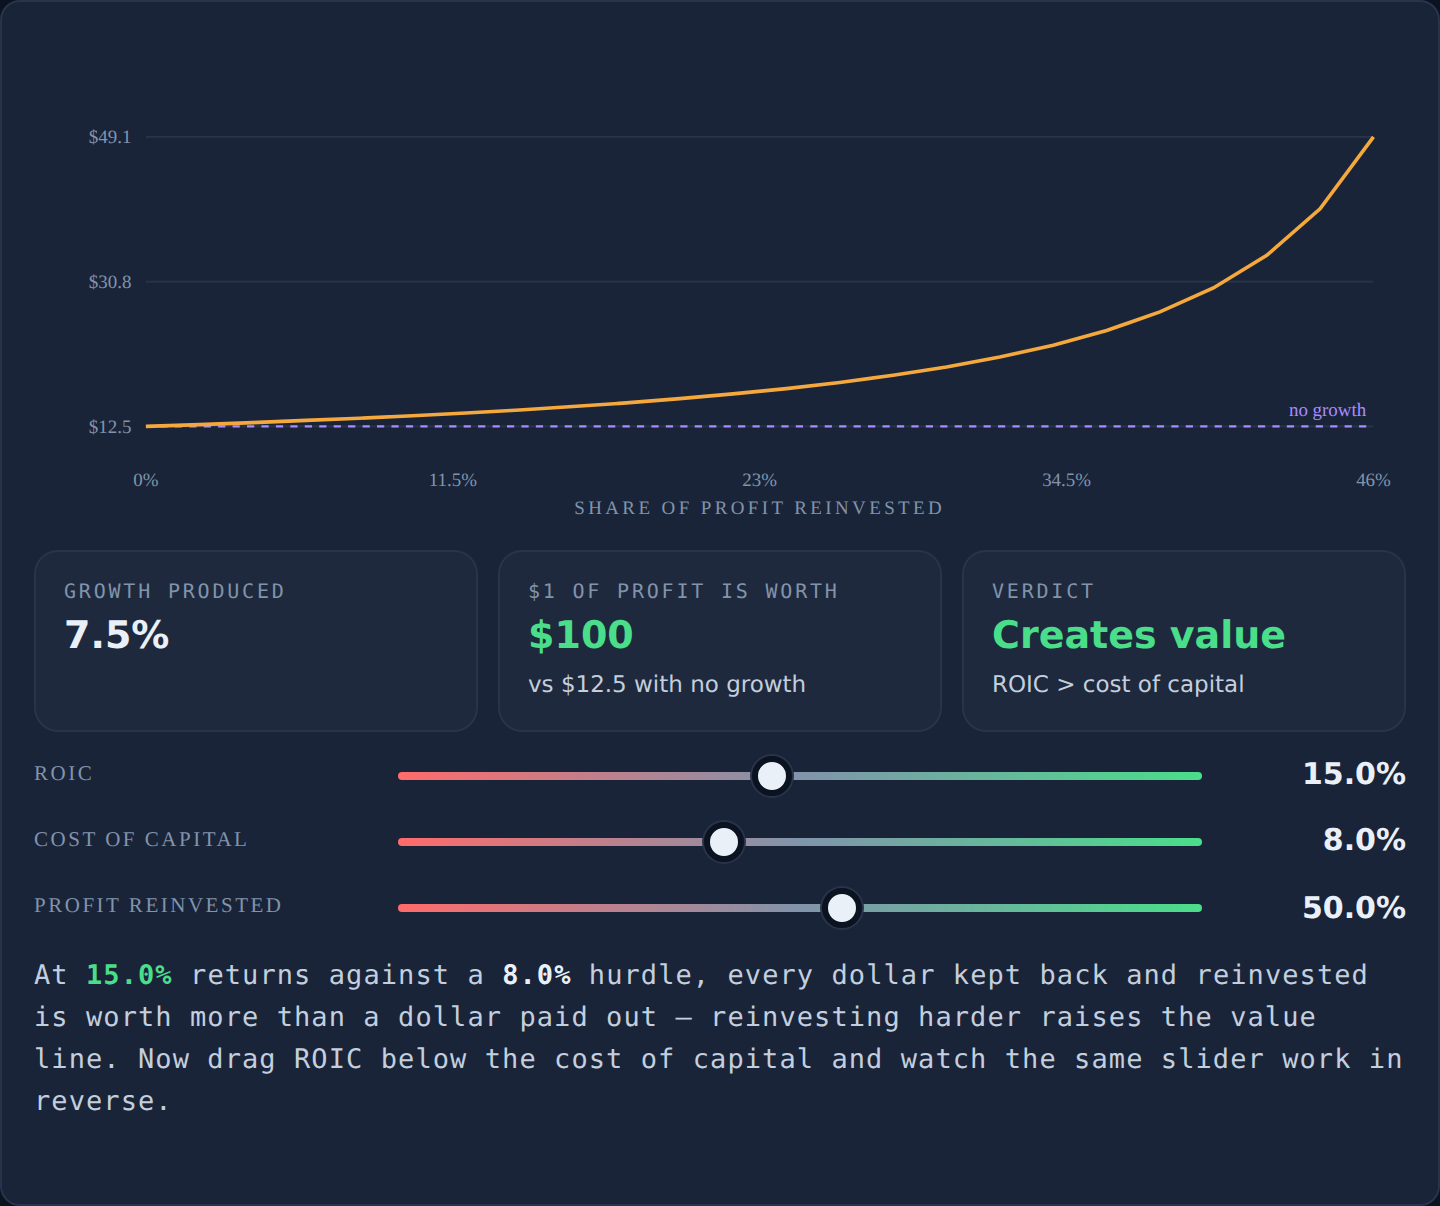
Set ROIC below WACC, then drag the reinvestment rate — the share of profit retained — upward. Watch the growth rate produced rise while the value of $1 retained falls below a dollar and the verdict flips to destroys value: the company is growing itself smaller. Now push ROIC above WACC and drag reinvestment up again — the same slider now compounds value instead of burning it. The chart of value against reinvestment makes the whole argument in one line: reinvestment is an amplifier, and the ROIC-WACC spread decides what it amplifies.
DuPont analysis: split ROE before you trust it
Return on equity decomposes into three factors: net margin × asset turnover × equity multiplier. In words: profit per dollar of sales, times sales per dollar of assets, times how much of those assets were funded with borrowed money.
Three very different businesses can print the same 15% ROE. A luxury brand gets there on fat margin and slow turnover. A supermarket gets there on thin margin and fast turnover. A lender gets there mostly through the third factor — borrowing. Identical headline, completely different risk. Always split it before you judge it.
For fast growers, add the Rule of 40: revenue growth % plus free cash flow margin % should clear 40. A falling score is an early signal of a re-pricing; a score propped up by ignoring share-based pay is fiction.
Where this sits in the course
This is module 04 of The Ledger, between valuation multiples — which told you the price — and cash flow quality, which checks whether the profit in these ratios is real cash at all. The full lesson adds drills that have you build a five-year margin stack, compute incremental ROIC, and run the DuPont split on a competitor; the Fundamentals Grader scores margins and returns against sector peers automatically, and every formula here is on the Ratio Bench.
Work through module 04 — then never pay for growth without checking what it earns.
Frequently asked questions
What is the difference between ROIC and WACC?
ROIC (return on invested capital) is what a business earns on all the money put into it: after-tax operating profit divided by debt plus equity minus cash. WACC (weighted average cost of capital) is what that money costs — the blended rate at which the company can borrow and raise equity. The gap between them is the spread that decides whether reinvestment creates or destroys value.
When does growth destroy value?
Whenever the return on invested capital is below the cost of that capital. A company growing revenue 25% a year while earning 6% ROIC against a 9% cost of capital loses 3 cents a year on every dollar reinvested — and expanding faster makes the problem larger, not smaller. A fast-growing company earning below its cost of capital is one of the most reliable ways to lose money slowly, because the damage compounds.
How do you calculate ROIC?
Multiply operating profit by one minus the effective tax rate to get after-tax operating profit, then divide by invested capital: total debt plus total equity minus cash. Worked example: operating profit $657m at a 24% tax rate gives $499m; debt $1,850m plus equity $2,450m minus cash $420m gives $3,880m of invested capital; ROIC is 499 ÷ 3,880 = 12.9%. Cash is subtracted because money sitting in the bank is not running the business.
Why is ROIC better than ROE?
Return on equity is easy to flatter: borrowing more raises it, and so do share buybacks, because buybacks shrink the equity denominator. A 40% ROE at a company whose equity has been reduced to almost nothing tells you nothing about business quality. ROIC measures the return on all the money in the business — debt and equity alike — so it cannot be inflated by financing choices.
What is incremental ROIC?
The change in after-tax operating profit divided by the change in invested capital over three to five years. It is what the company earns on new money, rather than on everything it has ever invested — and it is the figure that decides whether growth helps or hurts from here. A plain ROIC of 15% with an incremental ROIC of 5% means the recent expansion has not paid.
What is DuPont analysis in simple terms?
DuPont analysis splits return on equity into three factors: net margin × asset turnover × equity multiplier — profit per dollar of sales, times sales per dollar of assets, times how much of those assets were funded with borrowed money. A luxury brand, a supermarket and a lender can all print the same 15% ROE through completely different factors, and the risk you are taking differs accordingly.
What is a good incremental margin?
One higher than the current operating margin. Incremental margin is the change in operating profit divided by the change in revenue — the economics of the next dollar of sales, which is what you are actually buying. If a company earns 25 cents of operating profit on each additional dollar of revenue while its average margin is 15%, growth is making the business better as it scales.
What is the Rule of 40?
A sanity check for fast-growing companies: revenue growth percentage plus free cash flow margin percentage should total at least 40. A company growing 30% with a 10% cash margin scores 40, and so does one growing 15% with a 25% margin. A falling score is one of the earliest signals that a highly rated share is about to be re-priced downward — but check that the margin half is not propped up by treating share-based pay as if it were not a cost.