Short Selling Analysis — Borrow Cost, Days to Cover, Squeezes
Short answer: Short selling analysis is not a buy case with a minus sign: the evidence, the mechanics and the clock are all different. Seven archetypes recur — decline, over-leverage, accounting problems, broken growth, excess capacity, one-product fads, serial acquirers — and each needs something that forces the price down. Before entering, price the position itself: a 12% borrow fee plus a 3% dividend means the shares must fall 15% in a year just to break even, and days to cover above about 5 means the exit is narrow. Shorts die three ways: too early, too crowded, or rescued.
Selling short means borrowing shares from someone who owns them, selling them at today's price, and buying them back later to return them. If the price falls, you keep the difference. If it rises, you pay it — and there is no ceiling on how far it can rise.
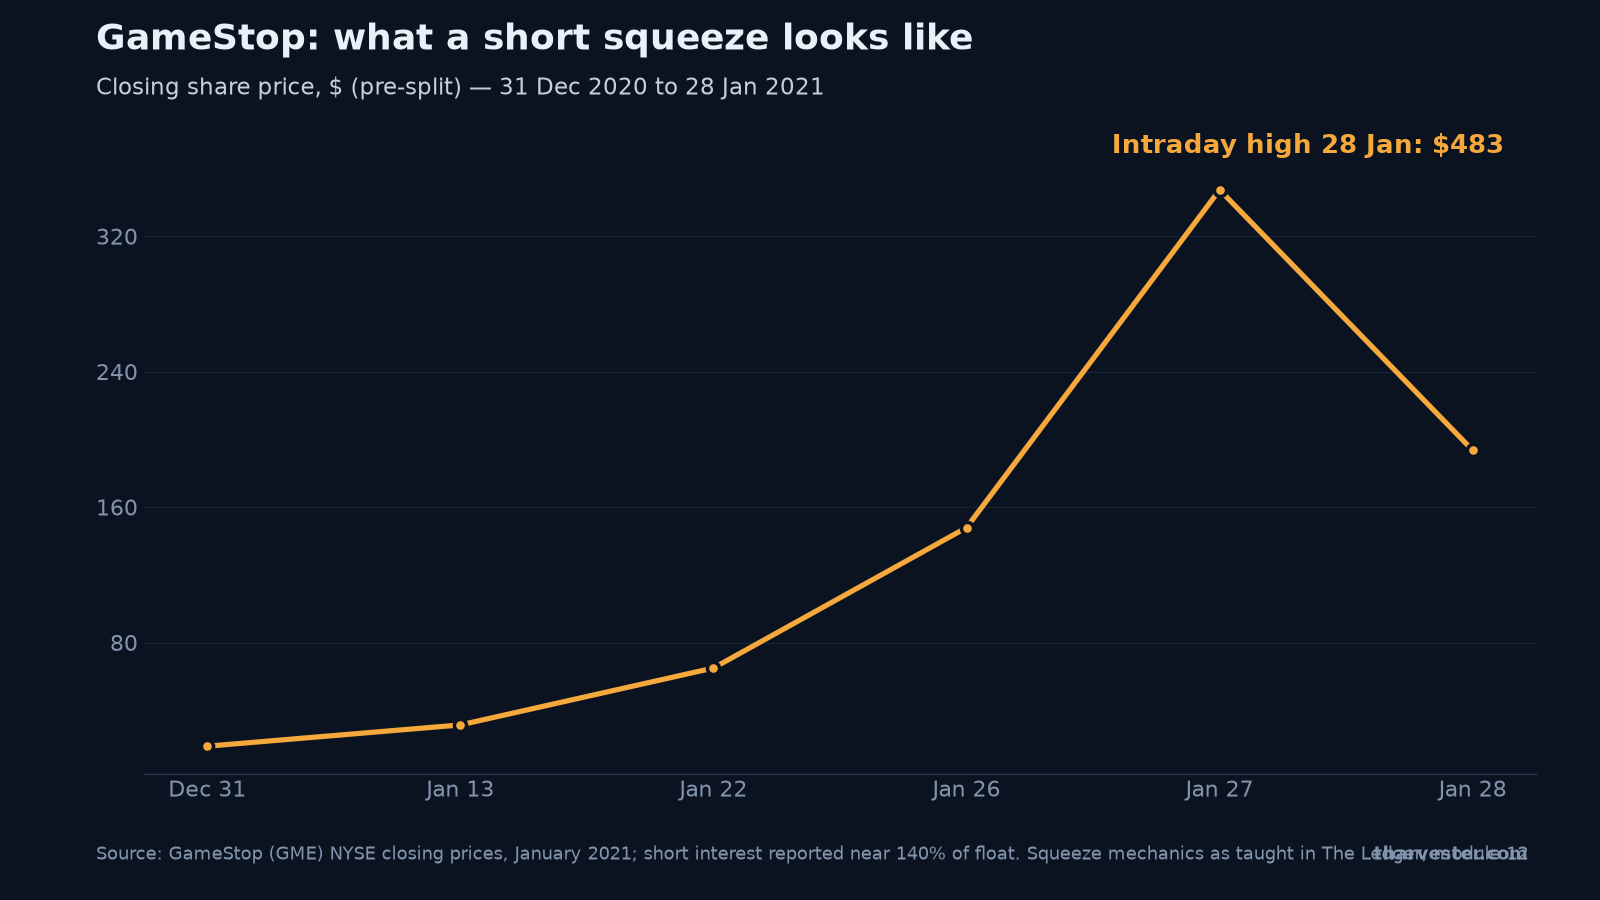
The chart above is the no-ceiling clause in action. It plots GameStop's closing price through January 2021: $18.84 at the close of 2020, $65.01 on 22 January, $347.51 on 27 January, with an intraday print of $483 the next day — while short interest was reported around 140% of the float. Almost nobody reading this will ever sell a share short, and that is fine. This module of The Ledger is worth the time anyway, because the people who do this professionally have the sharpest tools for identifying a business in trouble — and those tools are just as useful for deciding what not to own.
Short selling analysis is not a buy case with a minus sign
A short thesis needs different evidence, different mechanics, and a different clock. "Overvalued" is not enough — as the reverse DCF article before this one showed, an expensive price is just a demanding assumption, and demanding assumptions can be met. What a short needs is a pattern in the numbers plus something that forces the price down on a knowable schedule.
The seven short archetypes — and what forces the move
Seven patterns recur in companies that fall. Each pairs a signature in the numbers with a forcing event:
- Long-term decline. Falling volumes hidden by rising prices; margins compressing; equipment spending cut below the depreciation charge. Nothing dramatic forces the move — each quarter simply confirms the trend, and the valuation falls as the remaining life of the business shortens.
- Too much debt. Net debt to EBITDA rising, interest cover falling, a large repayment approaching. The forcing event is dated: a refinancing, a loan condition being tested, a rating cut. The leverage article earlier in the series builds this toolkit.
- Accounting problems. Profit running ahead of cash, collection times drifting, costs moved onto the balance sheet, a change of auditor — the full checklist from module 10. Forced by a restatement, a delayed filing, a regulator, or the auditor resigning.
- Growth story breaking. Organic growth decelerating, retention falling, the cost of winning customers rising. The valuation falls faster than the profits do — the market simply stops paying a premium.
- Too much new capacity. An industry-wide building boom two or three years earlier, now coming into service, with prices softening. New supply arrives on a schedule you can read in competitors' own reports.
- One-product companies. Revenue concentrated in a single item, no repeat purchases, heavy discounting. Comparisons get harder each quarter, stock builds up, prices get cut.
- Serial acquirers. Goodwill growing much faster than organic revenue, adjusted profit far above official profit, cash conversion falling. The deal machine stalls when borrowing gets expensive, and the underlying business is finally visible.
Two or three of these signatures show up in the Ratio Bench automatically — leverage, accruals, cash conversion — which is why running it before buying anything is cheap insurance.
The borrow fee math: what it costs to be right slowly
Being right about the business is not enough, because the position itself has running costs a purchase does not. Work the module's example: a $100,000 short position in a company whose shares are difficult to borrow, held for one year, while the company pays a 3% dividend.
- Borrow fee at 12%: −$12,000 — paid to the share lender
- Dividend owed: −$3,000 — you pay it to the lender, who still expects the income
- Total cost of one year: −$15,000 — 15% before any price move
- Break-even fall needed: −15% — just to finish level
The shares must fall 15% in the year for the position to break even. If the company is right about its own prospects and the shares rise 20%, the loss is 35%. Time is a cost, not an ally — and the lender can demand the shares back at any moment, forcing a purchase at the worst possible price.
Days to cover and squeeze risk — price the exit before you enter
Four mechanics deserve names. Short interest is the number of shares sold short as a percentage of the shares available to trade — crowding, not confirmation. Days to cover is short interest divided by average daily volume: how many days of normal trading it would take for every short to buy back. Above about 5 days, the exit is narrow and everyone knows it. A squeeze is the feedback loop where a rising price forces buying that raises the price further. And the equity issue defense is the most common thesis-killer of all: a company you think will run out of money simply sells new shares into a rising price and refills its bank account — precisely when sentiment is most against you.
Now price a position yourself. This is the short-side bench from the course:
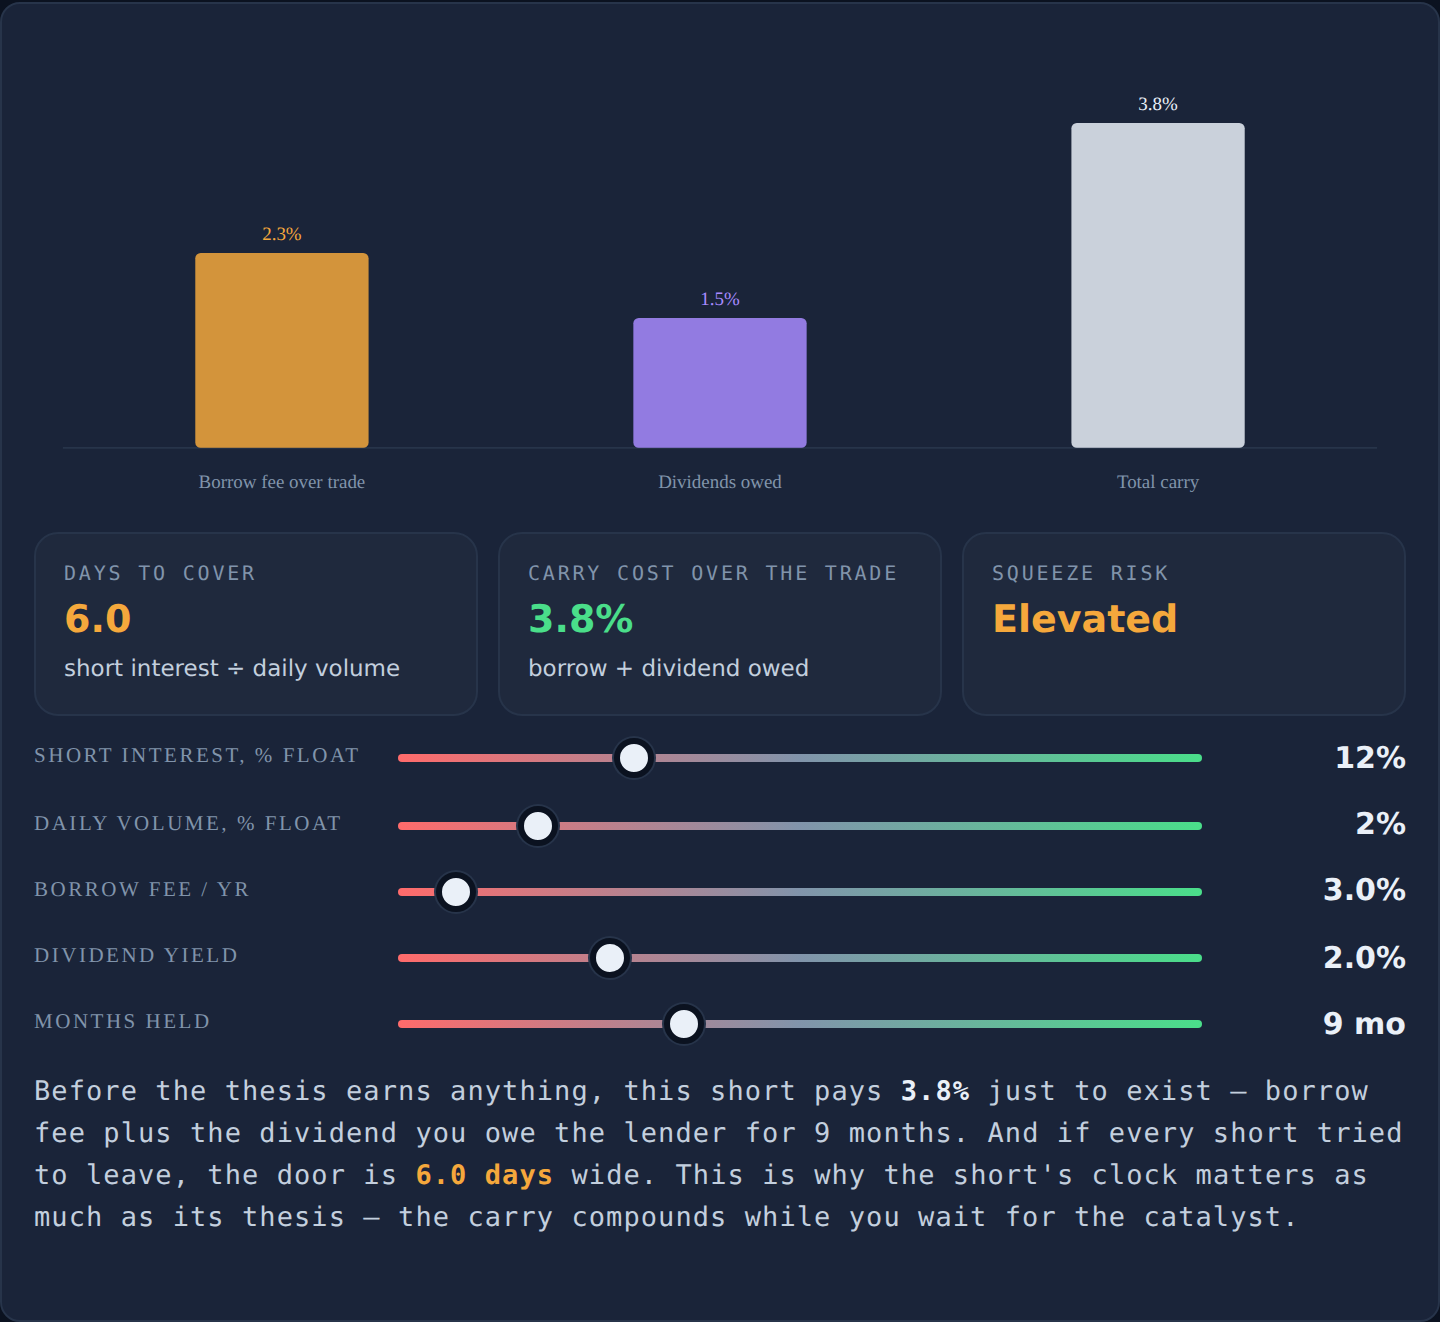
Drag short interest up toward GameStop territory and watch days to cover stretch as the squeeze-risk verdict deteriorates — then drag average daily volume up and watch the same short interest become survivable, because the exit widened. Next, set the borrow fee to 12%, the dividend yield to 3%, and months you expect to hold to 12, and read the total carry cost: the 15% break-even from the worked example, reproduced live. Halve the holding period and the carry halves with it — which is exactly why a short thesis needs a dated event, not just a direction.
The GameStop lesson in one chart
Go back to the hero chart. Every fundamental argument the shorts made in 2020 could have been correct, and the January 2021 price path would have destroyed the position anyway: at 140% of float reported short and closing prices multiplying eighteen-fold in under a month, the buying was forced, reflexive, and indifferent to fair value. That is the second of the module's three ways shorts die: too early (right analysis, ruinous timing), too crowded (right, widely known, already priced — you get the squeeze instead of the fall), and rescued (a share issue, takeover, policy change or commodity move repairs the company). Write down which of the three is most likely for your specific case before committing.
Because the possible loss is unlimited and waiting costs money, the analysis and the expression are two different decisions. Positions with a fixed maximum loss and a fixed expiry — or owning the strongest company in an industry against the weakest — turn open-ended risk into a budgeted one. Choose the timeframe from when you expect the event, not from what looks cheapest.
Keep going
The full lesson — Betting against a company, on its own terms — adds drills on matching a real company to an archetype, pulling short interest and borrow fee data for free, and studying a short that was rescued by a share issue. It is module 12 of The Ledger, free with no signup; unfamiliar terms live in the glossary. Next in the series, the same positioning data turns into a sentiment toolkit: insider buying, short interest and buyback timing.
Learn the short side on its own terms in module 12 — even if you never short a share.
Frequently asked questions
How does short selling work?
Selling short means borrowing shares from someone who owns them, selling them at today's price, and buying them back later to return them. If the price falls, you keep the difference; if it rises, you pay it. Unlike buying, the position has running costs — a borrow fee paid to the share lender, plus any dividends the company pays, which you owe to the lender — and the possible loss is unlimited.
What is days to cover?
Days to cover is short interest divided by average daily trading volume: how many days of normal trading it would take for everyone betting against the company to buy back their shares. Above about 5 days, the exit is narrow and every participant knows it. It is a measure of crowding and friction, not a verdict on the business.
What does a high borrow fee mean for short sellers?
The borrow fee is the annual rate paid to the share lender, and it is the running cost of being short. At 12% a year on a $100,000 position, waiting costs $12,000 before any price move; add a 3% dividend yield the short seller must pay to the lender and the shares must fall 15% in twelve months just to break even. A high fee means the trade is expensive to hold and usually crowded.
What is a short squeeze?
A squeeze happens when a rising price forces short sellers to buy back shares, which pushes the price higher, which forces more buying. Small share counts, heavy retail attention and index inclusion all make it more likely. GameStop in January 2021 is the canonical case: with short interest reported around 140% of the float, the shares ran from under $19 at the turn of the year to an intraday high of $483 on 28 January 2021.
Is high short interest bullish or bearish?
Neither — it is positioning data, not fundamental data. High short interest is not confirmation that the bears are right; it means the idea is crowded and everyone is trying to leave through the same door. Much of the expected fall may already be in the price, and the crowding itself becomes squeeze fuel. Read it as fuel and friction, never as evidence about the business.
What patterns do short sellers look for?
Seven archetypes recur: long-term structural decline, too much debt approaching a refinancing, accounting problems where profit runs ahead of cash, a growth story breaking, an industry that built too much capacity, one-product companies running out of buyers, and serial acquirers whose deal machine stalls. Each has a signature in the numbers — and, critically, something that eventually forces the price down, like a covenant test, a restatement, or new supply arriving on a public schedule.
Why do short sellers have to pay dividends?
Because the person who lent the shares still expects the dividend income they would have received. The borrower sold the shares to someone else, who collects the actual dividend — so the short seller pays an equivalent amount out of pocket to the lender. On a 3% yielding stock, that adds 3 percentage points a year to the cost of holding the position.
What are the main ways a short thesis fails?
Three ways: too early — the analysis is right and the timing ruins you anyway; too crowded — the case is right, widely known, and already in the price, so you get the squeeze rather than the fall; or rescued — a share issue, a takeover approach, a policy change or a commodity move repairs the company. The most common rescue is the equity issue defense: a company you think will run out of money simply sells new shares into a rising price. Write down which of the three is most likely before committing.