Valuation Multiples Explained — Both Sides of Every Ratio
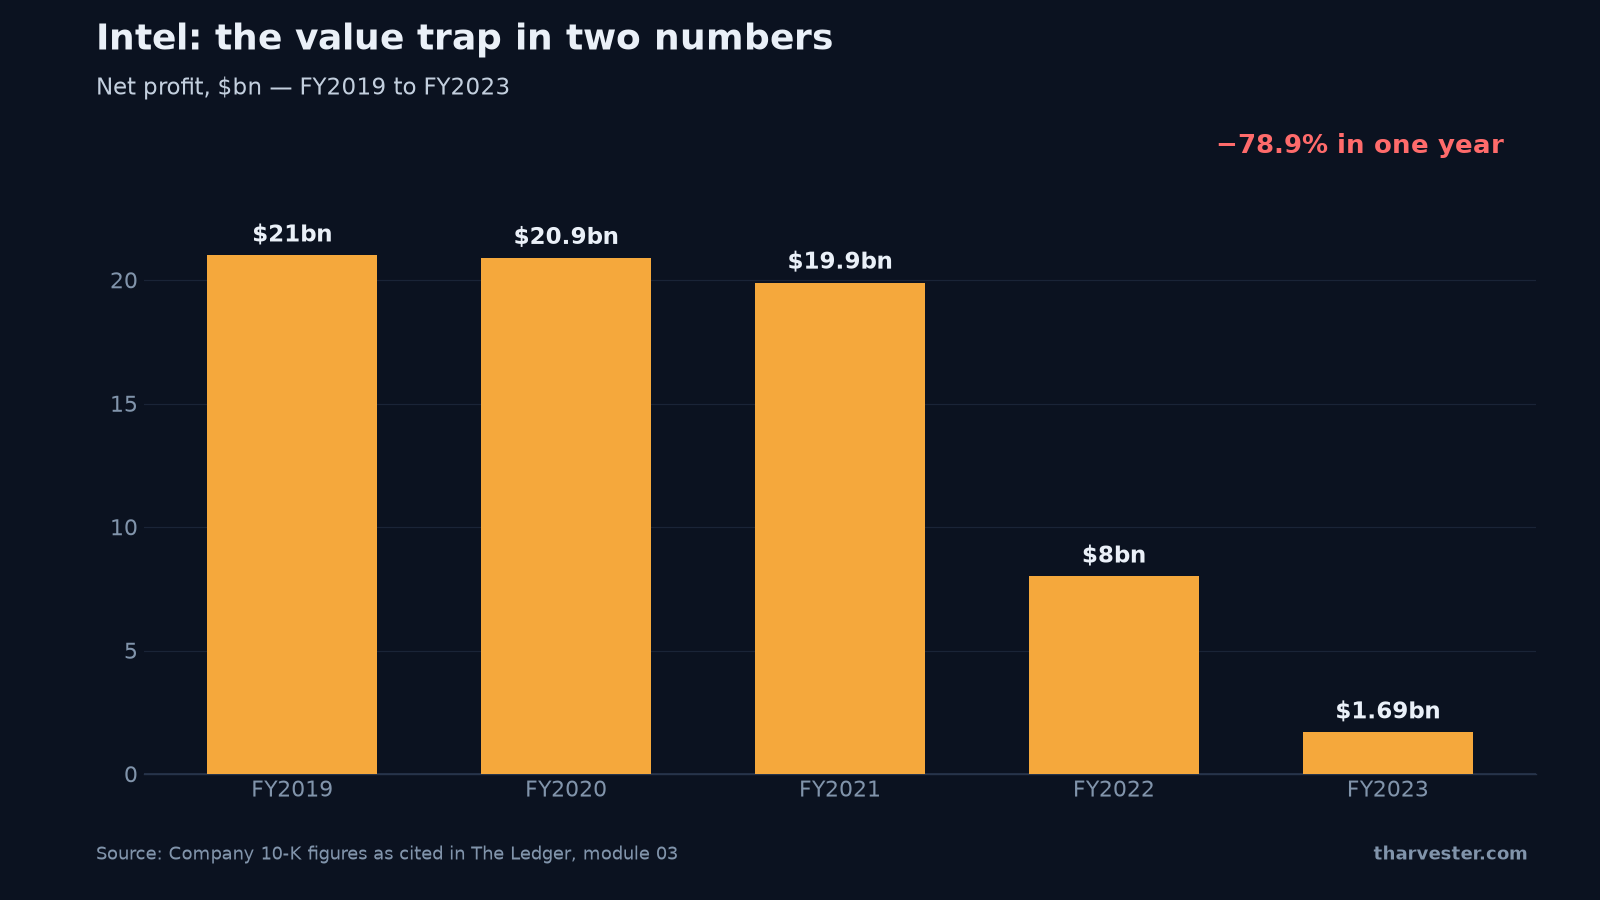
Short answer: A valuation multiple compares what a company costs to something it produces — profit, sales, cash. A low multiple is only cheap if the number underneath it holds up: Intel looked cheap on earnings until net profit fell 79% in one year, from roughly $8bn in FY2022 to $1.69bn in FY2023. Use multiples to compare and to raise questions, never to conclude, and always read each one from both the long side and the short side.
A valuation multiple compares what a company costs to something it produces — profit, sales, cash. It squeezes growth, risk, capital intensity and durability into a single number. That compression is what makes multiples useful, and exactly what makes them dangerous.
The chart above is the danger in one picture. It plots Intel's reported net profit by fiscal year, ending at $1.69bn for FY2023 — down 78.9% on FY2022, when Intel earned roughly $8bn. Through that period, Intel's shares were widely described as cheap on earnings. Then the earnings moved. This article walks through every major multiple the way The Ledger does — with the reading that supports buying and the reading that supports betting against, because every ratio has both.
What valuation multiples actually tell you
Use multiples to compare and to raise questions. Never use one to reach a conclusion on its own. Underneath all of them sits one principle: a company deserves a high multiple only if it earns good returns on the money invested in it, can grow, and can keep doing both for a long time.
This is module 03 of the fundamentals course — it builds directly on market cap and enterprise value, because half the multiples below use enterprise value as the price tag, and getting that denominator wrong poisons everything downstream.
P/E ratio and earnings yield, with the arithmetic
The price-to-earnings ratio is the share price divided by earnings per share. It answers: how many years of current profit am I paying for? A share at $40 with earnings of $2 per share trades at $40 ÷ $2 = 20 times earnings.
Turn it upside down and you get the earnings yield: $2 ÷ $40 = 5%. That is the profit the business earns each year as a percentage of what you paid, directly comparable against a government bond.
The long reading. A low P/E on stable or growing profits, at a company without heavy debt or unusual accounting, pays you a high return to be patient. A P/E of 8 is an earnings yield of 1 ÷ 8 = 12.5%. And a high P/E can mark a bargain in boom-and-bust industries — a small trough-year profit makes the ratio look enormous at exactly the moment the shares are cheapest.
The short reading. A low P/E is the classic signature of a value trap: a share that looks cheap and gets cheaper, because the profit underneath it is disappearing. The causes are usually specific — profits at a cyclical peak, one large contract expiring, an industry in permanent decline.
Is a low P/E cheap? Intel, FY2022 → FY2023
This is what a value trap looks like from inside the numbers, taken straight from the module:
- Net profit 2023: $1.69bn — down 78.9% on 2022
- Data center revenue: $15.5bn — from $19.4bn
- Data center profit: −$530m — from +$1.3bn
- Server chip volume: −37% year on year
A ratio is only as good as the number underneath it. When profit falls 79% in a year, a P/E calculated on last year's profit describes a company that no longer exists, and a P/E on this year's profit looks alarmingly high — for the same business at the same price.
The useful question was never "is the ratio low?" It was "why is the market expecting profits to keep falling, and is it wrong?" That question points at market share, competitors, and the cost of the factories Intel was committing to build. None of those answers are in the ratio.
PEG ratio problems — the one to handle with gloves
The PEG ratio divides the P/E by the expected growth rate in percent. A P/E of 20 with 20% growth gives a PEG of 20 ÷ 20 = 1.0; the rule of thumb says below 1.0 is attractive.
The trap: PEG quietly assumes growth is steady, free, and equally valuable however it was obtained. It is not free. Growth funded by issuing shares or by borrowing, at returns below the cost of that money, destroys value while making PEG look better. Check the cash flow statement for acquisition spending — if growth is being purchased, PEG is flattering it.
EV/EBITDA vs EV/EBIT — which is the harder test?
EBITDA is earnings before interest, tax, depreciation and amortization — in plain terms, operating profit with the depreciation charge added back. It strips out financing, tax and accounting policy, which is why it is the working language of takeovers and bank lending.
The catch is in the definition. Adding depreciation back assumes equipment never needs replacing. For an airline, a telecom network or a semiconductor factory, replacement is not optional — it is the cost of remaining in business. That makes EV to operating profit (EV/EBIT) the harder test, because it leaves the depreciation charge in. Harder still: EV ÷ (EBITDA − capex), which asks what is left after actually maintaining the assets. And watch for "adjusted EBITDA" that also excludes share-based pay or rent — rebuild it yourself and the gap tells you which costs the company hopes you will ignore.
Now try the whole family at once. This is the multiples bench from the course — one company under five price tags:
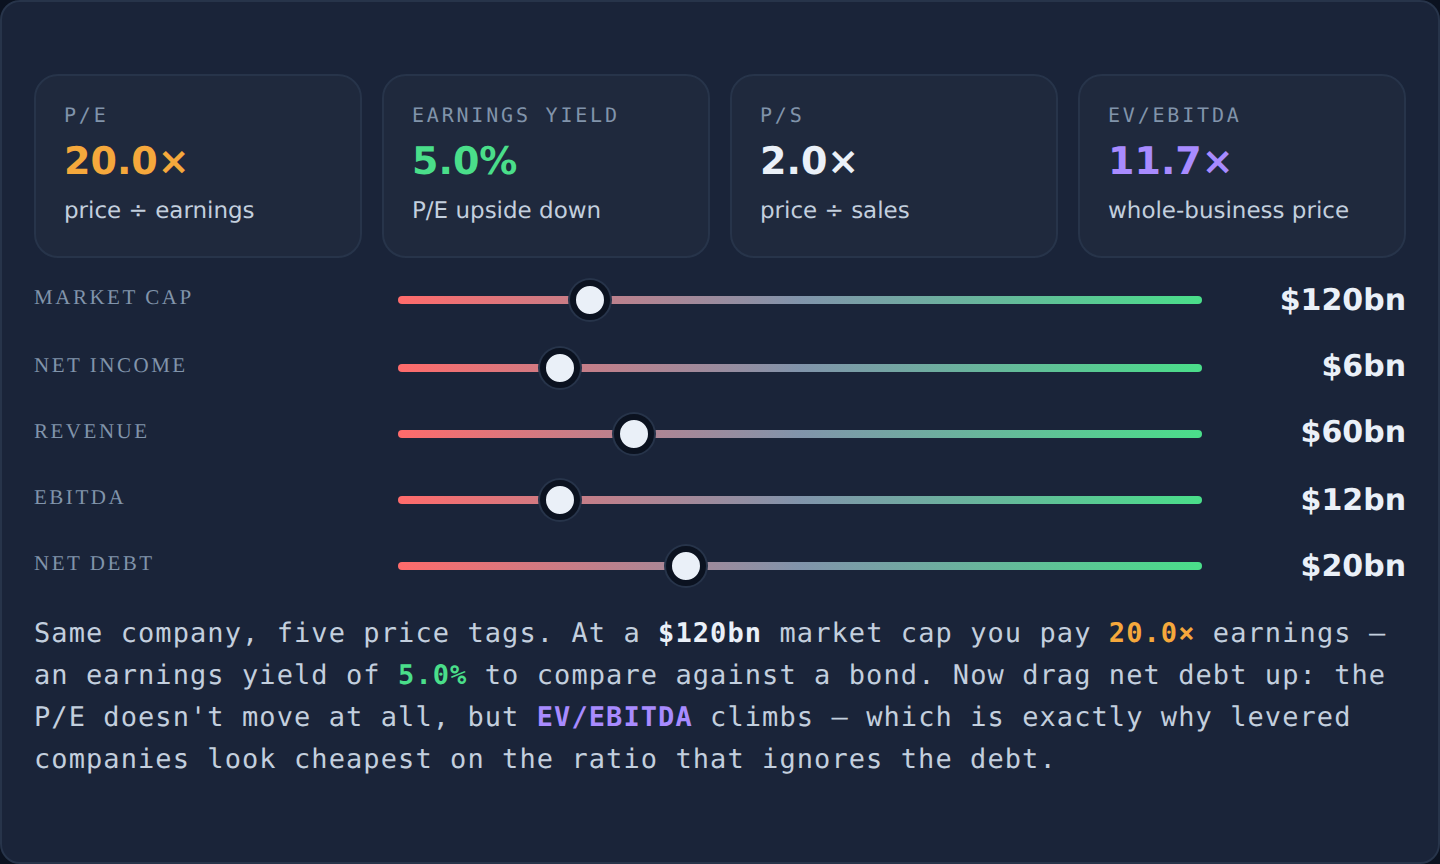
Drag market cap down and watch every equity-based ratio — P/E, P/S — fall in lockstep while the earnings yield rises. Then drag net debt up and notice what moves: EV/EBITDA climbs while P/E does not flinch, because debt lives in enterprise value, not in market cap. That gap is exactly why two companies on the same P/E are not equally priced if one of them also owes billions. Finally, cut net income the way Intel's fell and watch the P/E explode on an unchanged price — the value trap, reproduced with a slider.
Price to book, and free cash flow yield — the one that matters most
Price to book divides market cap by balance-sheet equity; price to tangible book removes goodwill and intangibles first. These are genuinely informative where the balance sheet is the business — banks, insurers, property, shipping — and close to meaningless for asset-light companies, whose real assets were never purchased and so were never recorded.
Free cash flow yield is cash from operations minus capex, divided by what you paid. A company generating $80m of free cash flow on a $1bn market cap yields $80m ÷ $1,000m = 8% — the closest thing to a real cash return on your purchase price.
Its short-side reading is the sharpest in the toolkit. Netflix in FY2019 was profitable on the income statement and burning cash at the same time: free cash flow of −$3.5bn, cash content spend around $15bn, long-term debt of $12.4bn by September, and $2.2bn of new bonds sold that October to fund the gap. Profit looked fine because content costs were charged against profit slowly; the bank balance told the truth immediately. The FCF yield forces you to have the argument the P/E lets you avoid.
Never judge a multiple against one number
The habit that separates an opinion from an argument: gather four reference points before deciding whether a multiple is high or low. The company's own range over the last five to ten years. Two direct competitors, calculated the same way. The multiple implied by a reverse DCF. And what the last takeover in the industry actually paid. The Ratio Bench is built for exactly this, and the Fundamentals Grader automates the peer comparison against sector-adjusted bands.
Keep going
The full lesson — Valuation multiples, read from both sides — adds dividend cover, shareholder yield, a which-ratio-for-which-business table, and drills that have you compute each ratio on a company you choose. It is module 03 of The Ledger, free with no signup. Next in this series: multiples tell you the price; ROIC vs WACC tells you whether the business deserves it. Terms you meet along the way live in the glossary.
Read multiples from both sides in module 03 — and never trust a lonely ratio again.
Frequently asked questions
Is a low P/E ratio always cheap?
No. A low P/E on stable or growing profits at a company without heavy debt is a genuine bargain signal — a P/E of 8 is a 12.5% earnings yield. But a low P/E on peak-cycle profits, an expiring contract, or a declining industry is the classic value trap: the price looks cheap because the market expects the earnings underneath it to shrink. The risk lives in the bottom of the fraction, not the top.
What is a value trap in stocks?
A value trap is a share that looks cheap on a ratio and gets cheaper, because the profit the ratio is built on is disappearing. Intel is the textbook case: widely called cheap on earnings, then net profit fell 78.9% from FY2022 to FY2023 as data center revenue dropped from $19.4bn to $15.5bn. The same share price went from looking cheap to looking expensive without moving, because the E collapsed.
What is the difference between EV/EBITDA and EV/EBIT?
EV/EBITDA adds depreciation and amortization back to operating profit before dividing, which quietly assumes equipment never needs replacing. EV/EBIT (enterprise value to operating profit) leaves the depreciation charge in, so it is the harder, more honest test — especially for airlines, telecoms, shipping and semiconductor companies, where replacing equipment is the cost of staying in business.
What is earnings yield and how do you calculate it?
Earnings yield is the P/E ratio turned upside down: earnings per share divided by the share price. A share at $40 earning $2 per share yields $2 ÷ $40 = 5%. Its value is comparability — you can hold that 5% directly against the interest rate on a government bond and ask whether the extra business risk is being paid for.
Why is the PEG ratio misleading?
PEG divides the P/E by the expected growth rate and calls anything below 1.0 attractive. It quietly assumes growth is steady, free, and equally valuable however it was obtained. Growth funded by issuing shares or borrowing at returns below the cost of that money destroys value while making PEG look better — a PEG of 0.6 built on acquired earnings growth is a warning, not a bargain.
What is a good free cash flow yield?
A durable free cash flow yield of 8–10% with a stable share count means the business can fund its own dividend, buybacks or debt repayment without asking anyone's permission. But a high yield can also be a business being run down — cash harvested by skipping equipment replacement, or generated by an asset with a finite life. Check capex against depreciation before trusting it.
Which valuation multiple should I use for banks?
Price to tangible book, read against return on equity. For banks and insurers the balance sheet is the business, and enterprise-value multiples are meaningless because debt is their raw material. A bank trading below tangible book while earning a solid return on that equity is the market saying it does not believe the loan book — which is a testable claim, not a verdict.
What is the difference between trailing and forward P/E?
Trailing P/E uses the profit already reported for the last twelve months — a fact. Forward P/E uses analysts' forecast for the next twelve months — an opinion. Both are useful; only one is checkable. When the two diverge sharply, the market is pricing a big change in earnings, and finding out why is more valuable than either number.