Volatility & Skew, Interactively: IV vs Realized, the Vol Smile, and Why the Average Lies
Volatility is where most retail options sellers get blindsided — not because the math is hard, but because the important numbers hide behind similar-sounding ones. Implied vs realized. Smile vs smirk. Average vs median.
The Volatility & Skew course in the Options School untangles them one lesson at a time, and its flagship lesson — why the average lies — is the single most important thing on this site for anyone selling premium. The simulators below are the live course widgets.
IV vs Realized: A Price vs a Fact
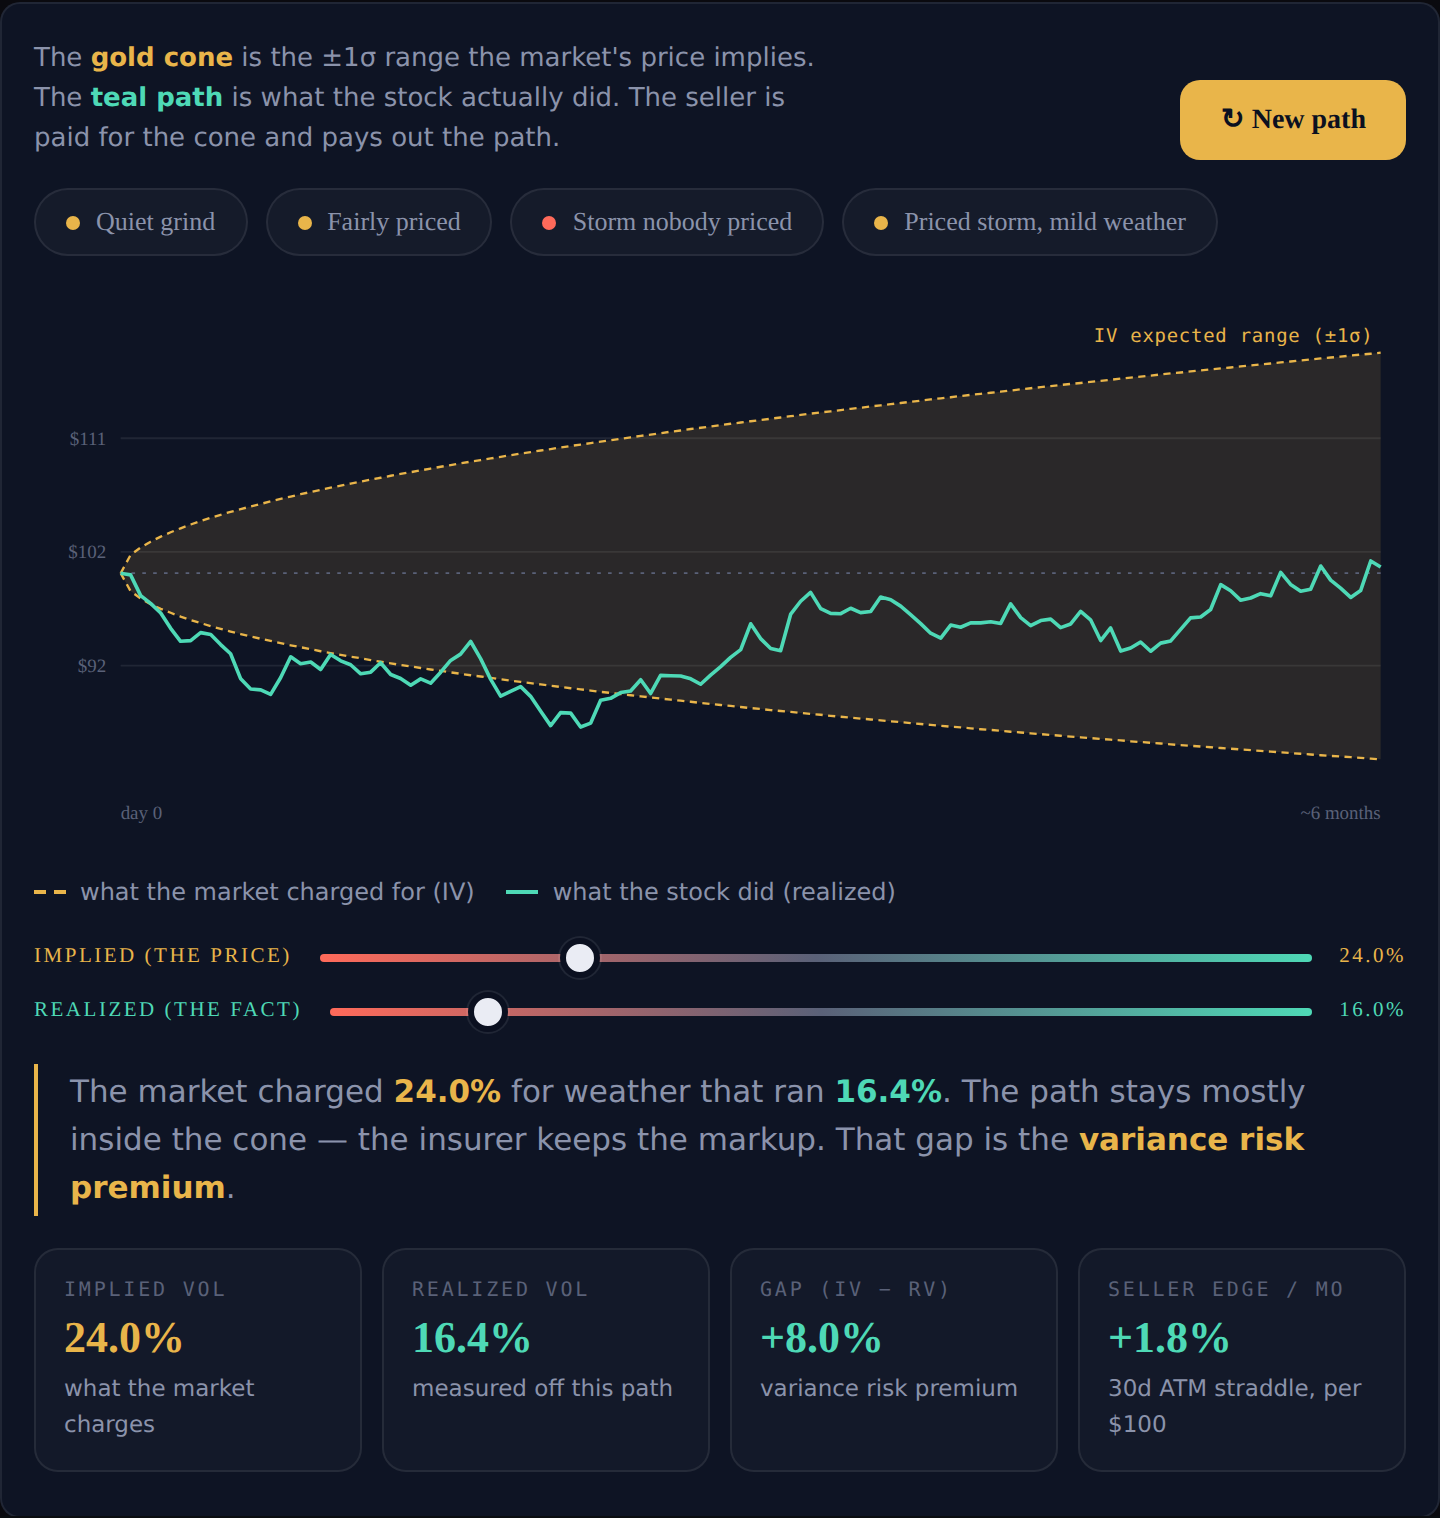
Two very different numbers share the name volatility. Realized volatility is a fact — the annualized wiggle of returns that already happened. Implied volatility is a price: the market's forecast of movement, plus a markup set by sellers who must pay out if they're wrong.
That markup is the variance risk premium: across most equity indices, most of the time, implied volatility has historically run a few points above the realized volatility that follows. It exists for the same reason hurricane insurance costs more than its actuarial fair value. Collecting that gap is the premium seller's structural edge.
Watch the edge form — and fail — in the explorer from the IV vs realized lesson, which draws the IV cone against a simulated realized path:
The Smile and the Smirk
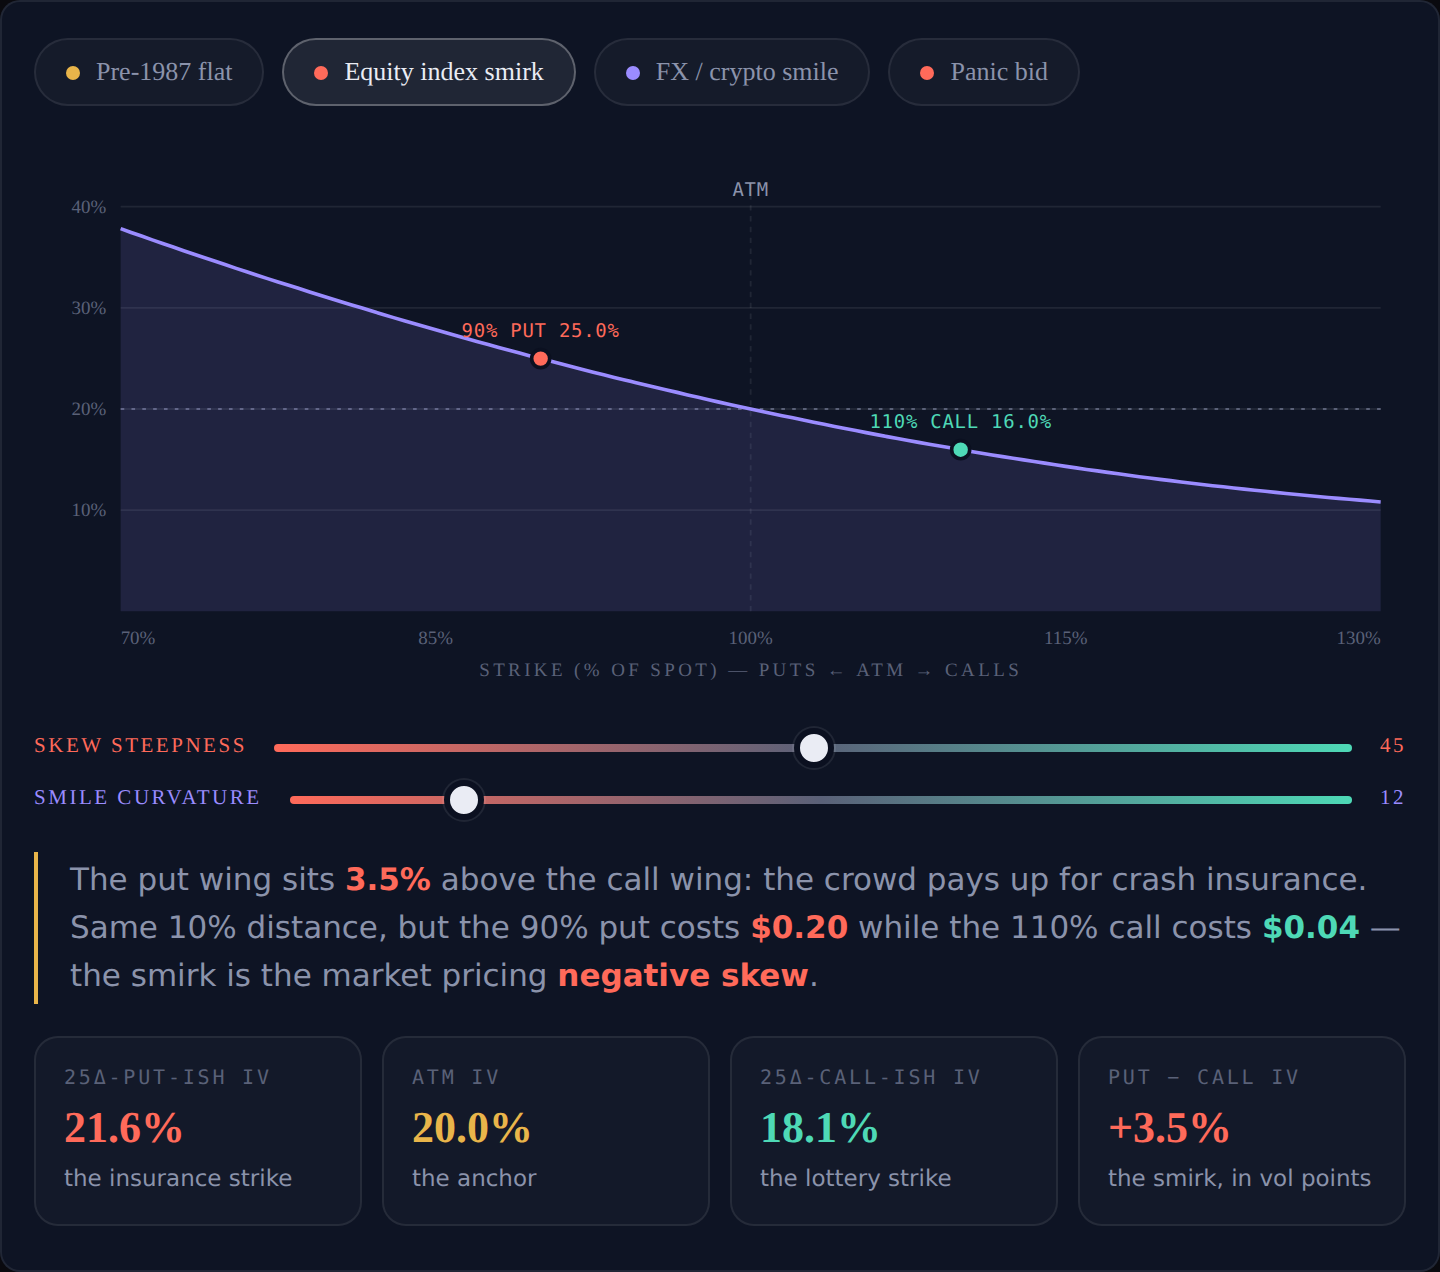
Black–Scholes assumes one volatility for every strike — a flat line. Real option chains disagree: on equity indices, the 90%-of-spot put trades several vol points richer than the 110% call, even though both sit the same distance from the money.
The curve wasn't always bent. Before October 19, 1987, index IVs sat roughly flat and deep OTM puts were nearly free. Black Monday happened anyway, and OTM index puts have carried a permanent premium ever since. The equity smirk is scar tissue — 1987 still being paid for, one month at a time.
Bend the curve yourself in the explorer from the vol smile lesson:
When you sell a put on a smirked index, you're being paid extra precisely to own the fat left tail. Which raises the question the flagship lesson answers: what does that tail do to your returns?
Why the Average Lies: Return Skew
Two strategies can earn the same return on paper and feel nothing alike. Skew is the shape of that difference.
Negative skew (selling puts, covered calls) means many small wins and a few brutal losses. Positive skew (buying OTM calls) means many small losses and the occasional moonshot. Neither is wrong — but negative skew has a property that ends accounts: pushed too hard, the typical month stays green while the realized average quietly goes negative.
The simulator from the skew lesson drives it home. Aim to sell puts at 2%/week and the typical month still reads about +9% — but roughly 85–90% of simulated accounts peak and then collapse over two years:
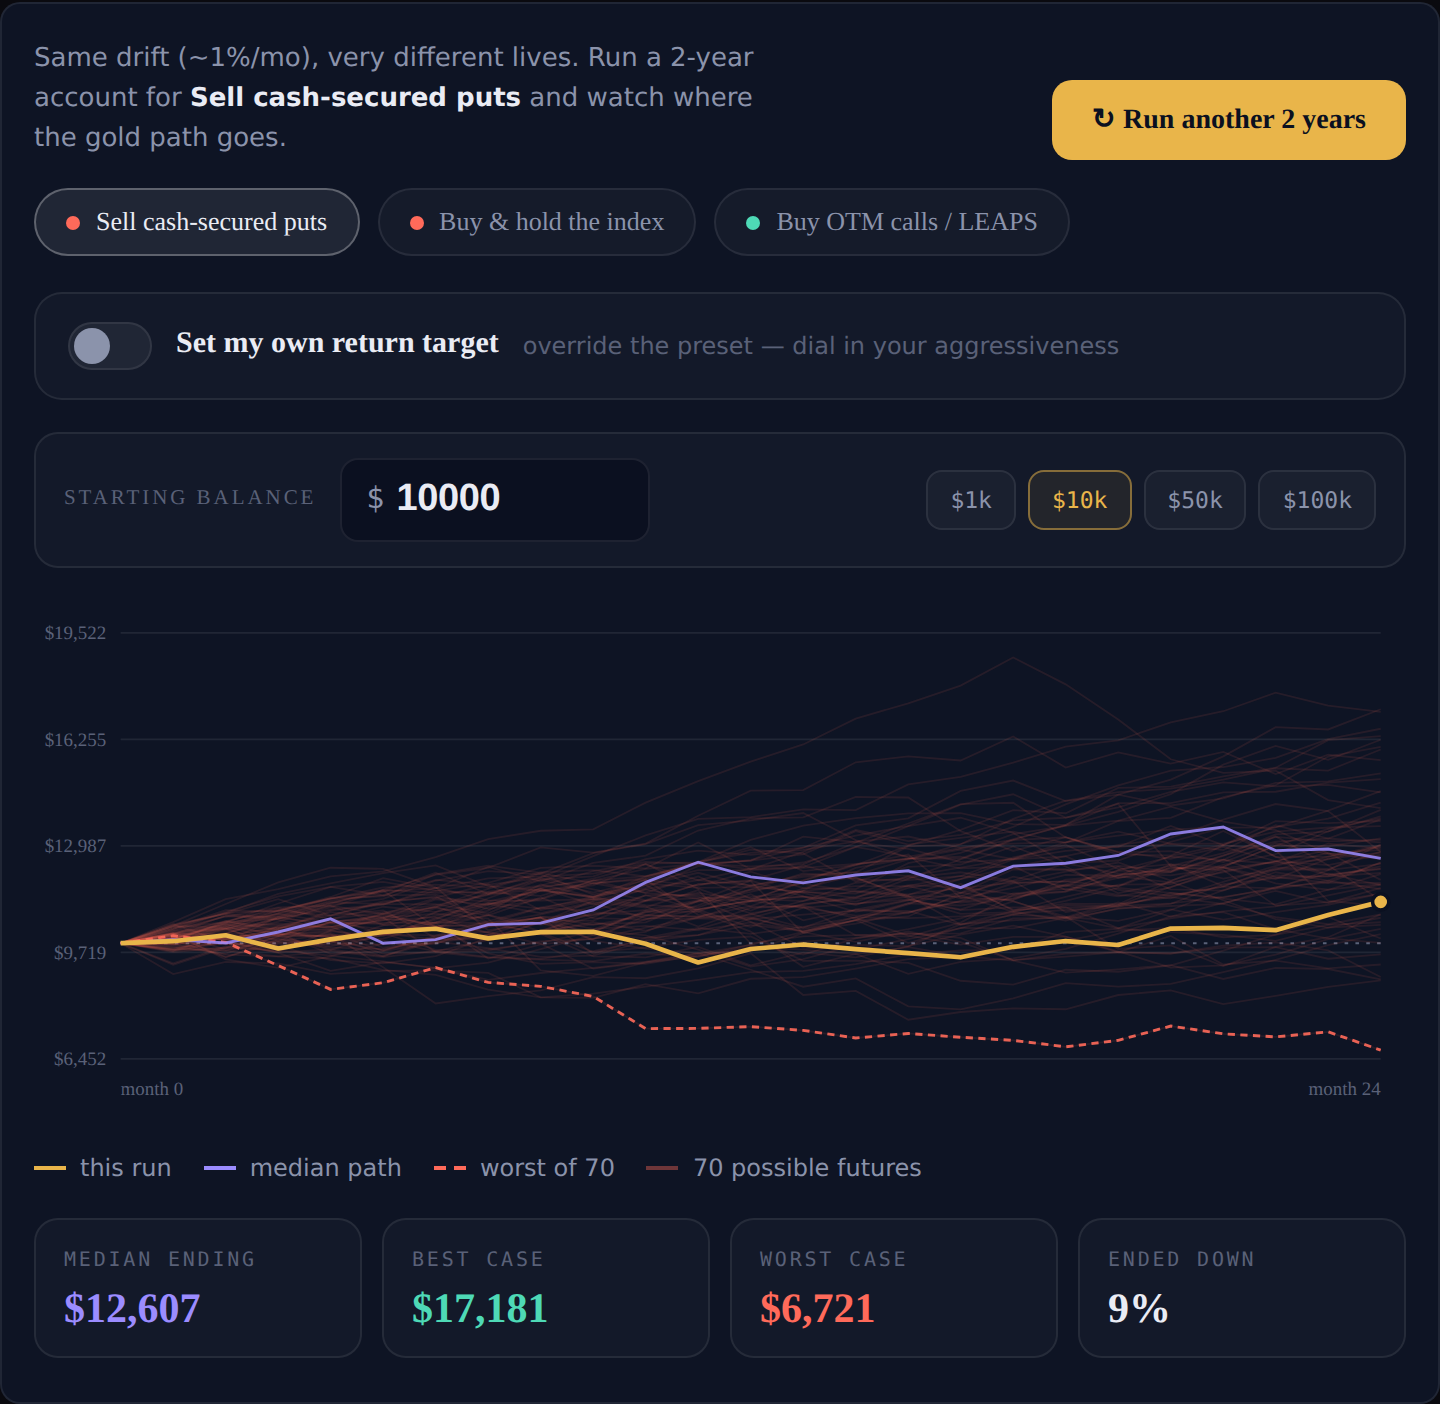
Run it a few times. The inversion — median outcome positive, mean outcome ruinous — is the whole lesson, and it's invisible in every summary statistic your broker shows you.
Why Sharpe Can't See It
The Sharpe ratio divides average return by standard deviation — and standard deviation squares every deviation, so a +5% month and a −5% month contribute identical risk. The ratio measures how wide your months spread, never which side the rare month lands on.
The explorer from the Sharpe lesson builds two accounts with identical Sharpe ratios by construction — one steady and symmetric, one a premium seller with a rare big loss — then lets you drag the rare month deeper while the Sharpes stay locked together:
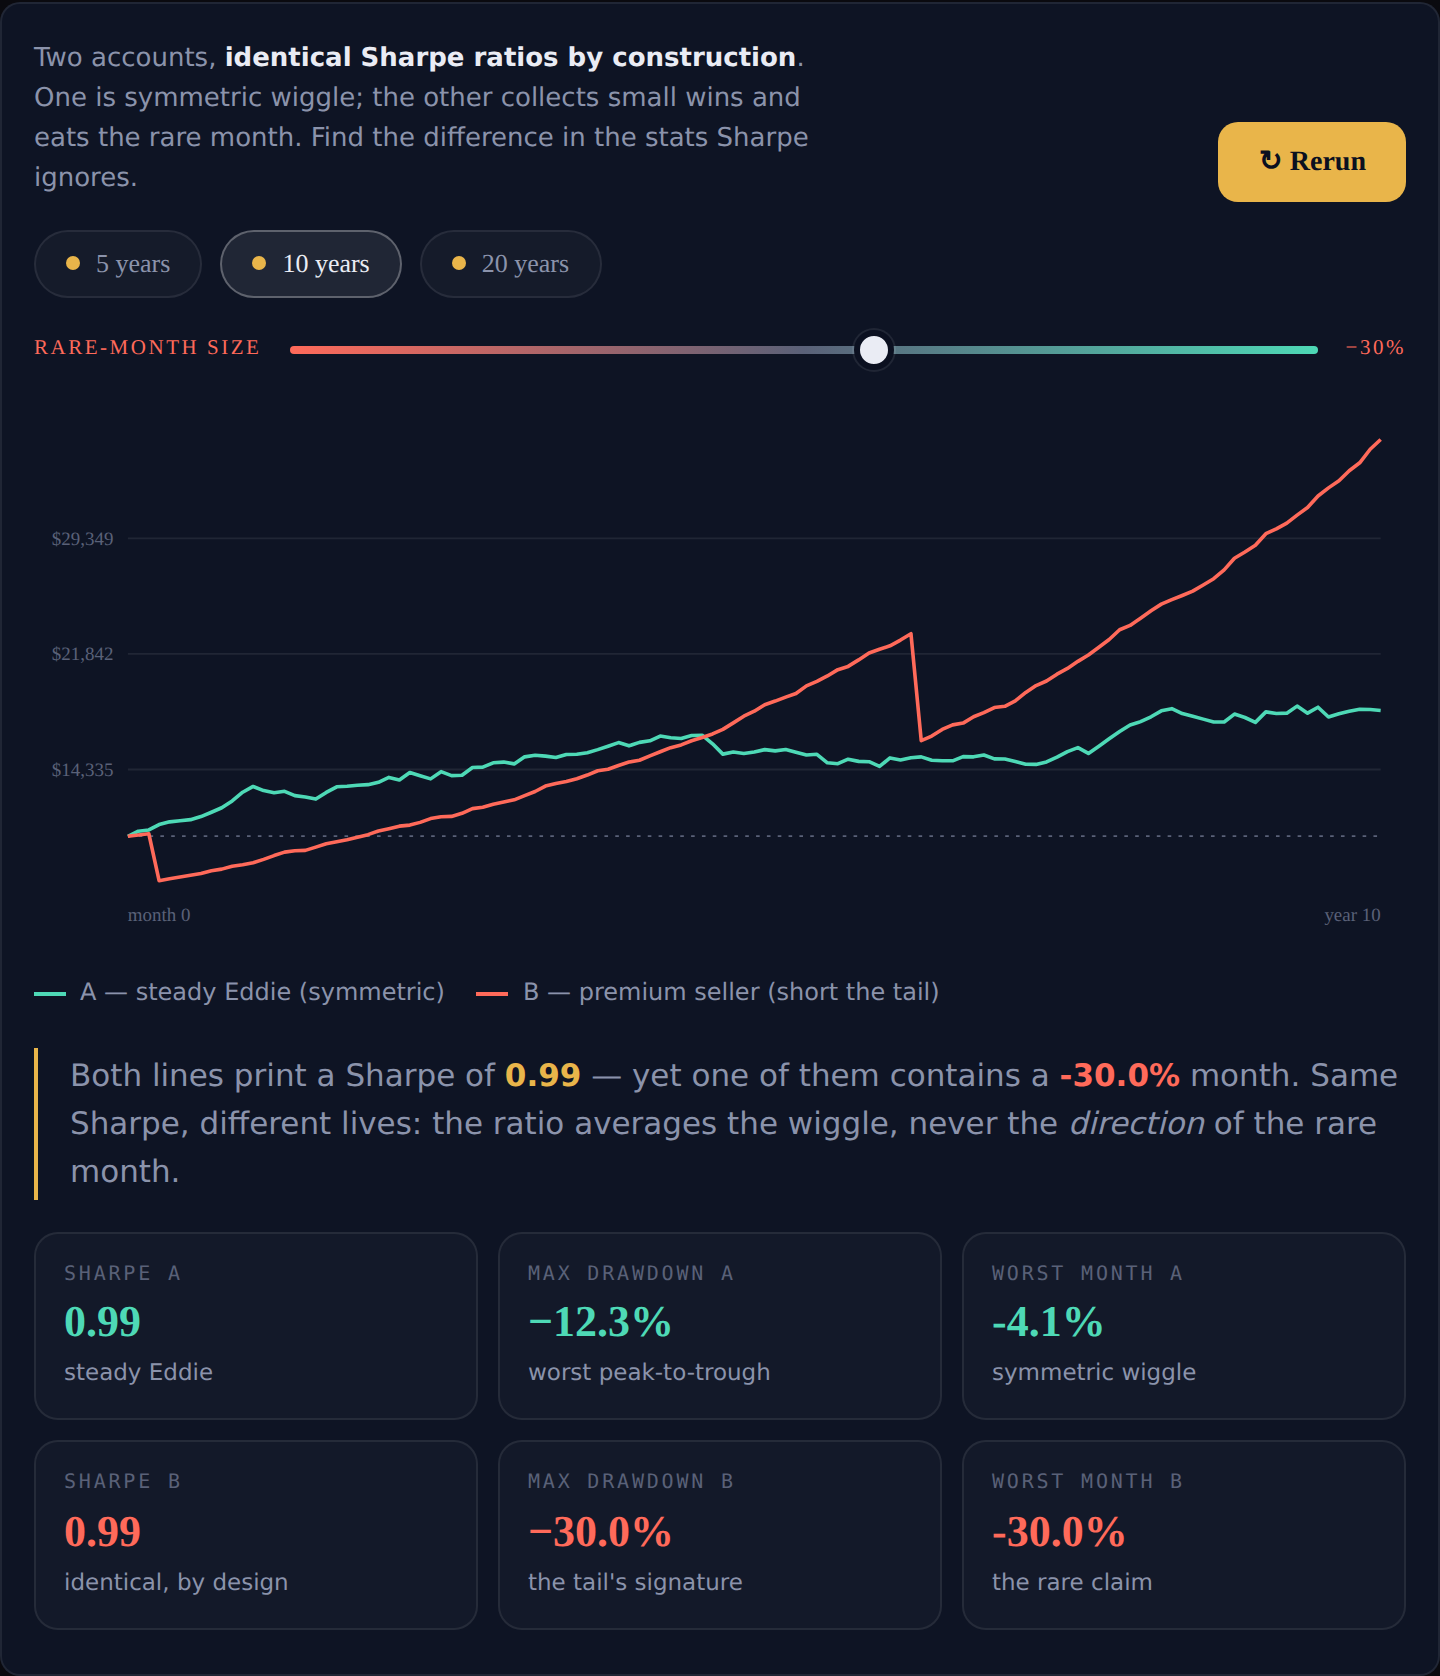
The fix is companions, not replacement: max drawdown (the one stat a fat left tail can't hide from), the Sortino ratio, and simply plotting the monthly histogram. Grading any track record — including your own — starts with demanding the worst month, not the average one.
Take the Full Course
The Volatility & Skew course covers all of this with quizzes and full lesson prose:
- IV vs realized — the variance risk premium and when it inverts
- The vol smile/smirk — why OTM puts cost more, since 1987
- Why the average lies — the flagship return-skew lesson
- Why Sharpe hides it — and the metrics that don't
There's also a standalone Skew Lab if you want the simulator full-screen. And when the theory needs to meet a real position, the Monte Carlo risk tab in ThetaHarvester runs these exact dynamics — correlated spot and vol — on your actual setup.